Does living through extreme weather make people act on climate?
After every major flood or heatwave, someone says it: this time people will finally take climate change seriously. I have heard it in Korea after the Seoul floods of 2022 and the Osong underpass disaster of 2023. The idea is appealing to those of us who study water, because it suggests that the hazards we measure will do the persuading for us. If extreme weather is becoming more frequent, then more people will experience it, and experience will turn into action.
A new paper in Nature Climate Change by Annika Wyss, Emmanuel Guizar Rosales and colleagues at the universities of Bern, Basel and Lüneburg tests this idea more carefully than most (Wyss et al. 2026). Their answer is uncomfortable but useful: in the United States, what people experienced mattered much less than how they interpreted it, and political affiliation shaped both what people looked at and what they chose.
How the study was done
Two features of the design make this paper worth reading closely.
First, it is a Registered Report. The authors submitted their hypotheses, methods and analysis plan to the journal before collecting any data, and the journal accepted the study in principle on that basis (the Stage 1 protocol was accepted in July 2025). The data were collected in August and September 2025. Because publication did not depend on the results, the paper reports its null findings as plainly as its positive ones. This matters here, since several of the main hypotheses turned out not to be supported.
Second, the choices were real, and the researchers could watch how people made them. About 2,000 US adults, quota-matched to the population by party, age, sex and region, completed 30 trials of a “Carbon Emission Task.” In each trial they chose between two options: one paid a larger bonus but caused more carbon emissions, the other paid less but emitted less. On average a bonus was about 60 US cents and the emissions about 20 pounds (9 kg) of CO₂. One trial was picked at random and carried out: the bonus was paid, and emission certificates were bought and retired to match the emissions. The information was hidden behind boxes that opened only when the cursor hovered over them, so the researchers could measure how long each person looked at the money and how long at the carbon. After strict quality checks, 1,451 participants remained.
Each participant’s county was then matched to the US National Oceanic and Atmospheric Administration’s Storm Events Database. A person counted as exposed if at least one episode of excessive heat, drought, wildfire, flash flood, coastal flood, hail, strong wind or tornado was recorded in their county in the 30 days before the study. Participants also reported which events they had experienced themselves, and how strongly they believed that extreme weather is caused by climate change (their subjective attribution).
Finding 1: party shapes attention, not only choice
Democrats made more pro-climate choices than Republicans, with roughly twice the odds of choosing the low-carbon option (odds ratio 2.06). That part is not surprising. The new result is that the difference already appears before the choice, while people are gathering information. Democrats spent a larger share of their looking time on the carbon numbers, about four percentage points more than Republicans.
One obvious explanation can be ruled out. Republicans might simply distrust emission certificates. They did not: both groups rated the certificates as equally effective (4.13 and 4.10 on a five-point scale). The partisan gap is in where attention goes, not in beliefs about whether the mechanism works.
Finding 2: recorded extreme weather did not change the picture
The authors expected recent exposure to extreme weather to widen the partisan gap, as some earlier studies had found. It did not. Exposure did not increase attention to carbon, and it did not change the difference between Democrats and Republicans. The result held across event types and across exposure windows from one to twelve months, and the authors also report equivalence tests for these null results.
Something else in the data is telling. In the final sample, Republicans were slightly more likely to have been exposed to a recorded event (48.2% against 43.4%). Yet Democrats reported having experienced more extreme weather. The same kind of storm record was turned into different memories by different people.
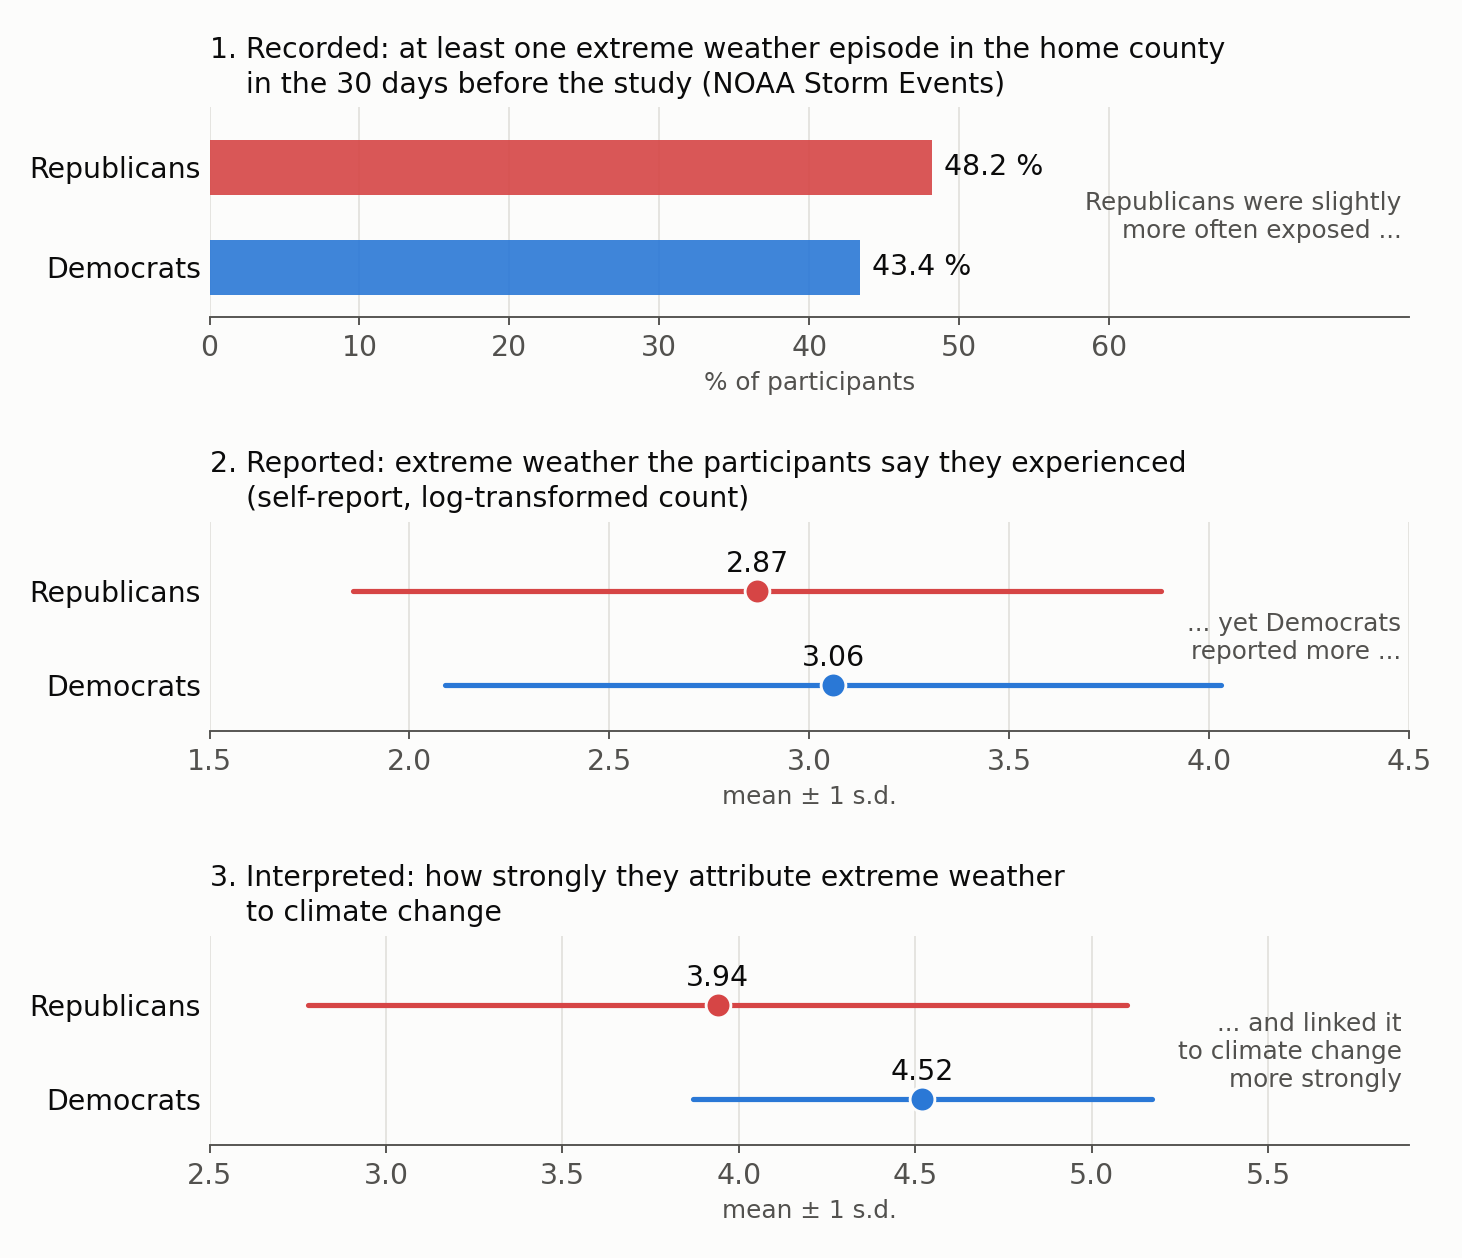
Figure 1. Three steps between a storm and a belief, by party, for the 1,451 participants in the final sample. Panel 1 shows extreme weather recorded in each participant’s county by NOAA. Panel 2 shows the extreme weather participants said they had experienced (a log-transformed count). Panel 3 shows how strongly they attributed extreme weather to climate change. Republicans were slightly more often exposed, yet Democrats reported more experience and linked it to climate change more strongly. Figure by Daeha Kim, drawn from group values reported in Wyss et al. (2026).
The authors put it in a phrase I find helpful: political affiliation may act as a perceptual filter that shapes how environmental experiences are encoded in memory.
Finding 3: interpretation is what matters
Subjective attribution, the belief that extreme weather is caused by climate change, was linked to more attention to carbon and more pro-climate choices, over and above party. Two interactions refine the picture.
- The partisan gap grew with attribution. It was largest among people who most strongly attributed extreme weather to climate change.
- Exposure helped only among people who did not already make the link. For people with low attribution, recent extreme weather was associated with more attention to carbon. For people with high attribution, it was associated with less. The authors offer two explanations: people who already care may have no more attention to give (a ceiling effect), or they may turn away from threatening information (avoidance). The study cannot tell which.
The hypothesis that tied all three factors together, that exposure would widen the partisan gap most among strong attributors, was not supported.
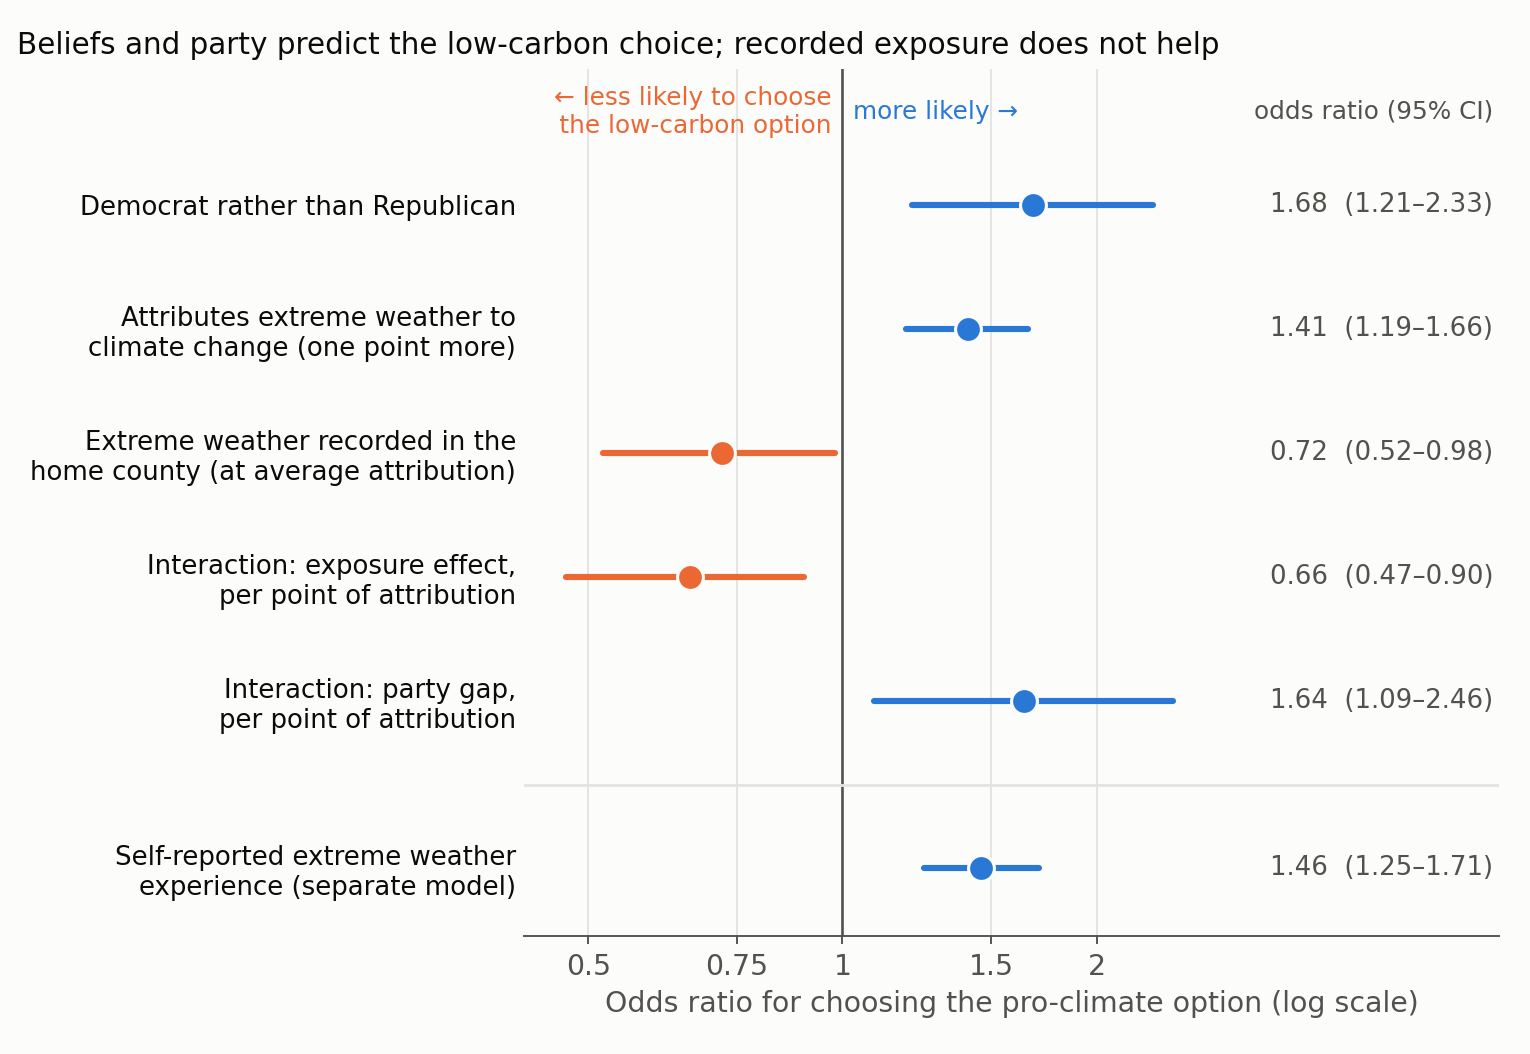
Figure 2. Odds ratios, with 95% confidence intervals, for choosing the low-carbon option, as reported in the paper. Values above 1 mean a higher chance of the pro-climate choice. The first five rows come from the models that include subjective attribution, so the exposure row is the effect of recorded extreme weather for a person with average attribution. The last row comes from a separate exploratory model with self-reported experience. Figure by Daeha Kim, drawn from numbers reported in Wyss et al. (2026).
Figure 2 summarizes the choice results. Party and attribution push toward the low-carbon option. Self-reported experience does too. Recorded exposure, for a person with average attribution, does not: if anything it goes the other way.
What I take from it as a hydrologist
A gauge record is not an experience. In hydrology we describe a flood by its peak discharge and its return period. Those numbers are what our infrastructure is designed for, and they are the right numbers for that purpose. But people do not experience a 100-year flood; they experience a flooded street, a closed road, or a news report, and they file it under an explanation they already hold. This study is a reminder that the hazard we measure and the experience that shapes behaviour are different quantities. The link between them runs through interpretation.
Event attribution is part of the service, not an extra. Climate science can now say, within days of an event, how much more likely or intense climate change made it. This study, together with earlier work, suggests that this kind of information is where the leverage lies. In the United Kingdom, flood experience predicted support for mitigation only among people who attributed the floods to climate change (Ogunbode et al. 2019). In California, wildfire exposure increased pro-environment voting only in Democratic areas (Hazlett & Mildenberger 2020). A survey of nearly 72,000 people in 68 countries found the same pattern: attributing extreme weather to climate change was linked to support for climate policy, while exposure to most types of extreme weather was not (Cologna et al. 2025). For those of us who provide climate services, for example drought information for farmers, explaining why an event happened may be as important as reporting that it happened.
Do not wait for disasters to do the persuading. People’s sense of “normal weather” also adapts quickly: a study of social media posts found that the reference point is set by the weather of only the past few years, so repeated anomalies soon stop being remarkable (Moore et al. 2019). Put together with this paper, the hope that more frequent extremes will eventually convince everyone looks weak. It is the same lesson as in my earlier post on the Atlantic overturning circulation: by the time the evidence is felt directly, much is already locked in.
Limits worth keeping in mind
The study is careful, but its scope is narrow.
- One country, two parties. US politics is unusually polarized on climate. Independents were asked which party they lean toward and classified accordingly. The results may not carry over to Korea or Europe, where views on climate may be less tied to party identity.
- Small stakes. Each choice involved cents and a few kilograms of CO₂. That is far from the decisions that matter most, such as buying a car, voting, or supporting a flood-defence levy.
- Attribution was measured, not manipulated. The study shows that attribution is associated with attention and choice; it does not show that changing someone’s attribution would change their behaviour.
- County-level exposure is a proxy. A storm recorded somewhere in a large county may never touch a given resident, which could dilute any real effect of exposure.
- About a quarter of the sample was excluded under the pre-registered quality rules, although analyses with the full sample gave similar conclusions.
Bottom line
- Political affiliation shapes not only what people choose but what they look at while choosing.
- Recent extreme weather recorded in people’s counties did not, by itself, increase attention to carbon or pro-climate choices, and it did not widen the partisan gap.
- What mattered was interpretation: people who see extreme weather as a consequence of climate change paid more attention to carbon and chose the low-carbon option more often.
- For scientists and engineers, the practical message is that hazard data need a story that connects them to their causes. Exposure alone is unlikely to do the work.
Questions to think about
- Republicans in this sample were more often exposed to recorded extreme weather, yet reported less of it. What could explain the difference between a recorded event and a remembered one?
- A flood frequency analysis treats a 100-year flood as the same event wherever it occurs. What would a “perceived return period” look like, and how could it differ between two communities hit by the same flood?
- If you were designing a drought early-warning bulletin for farmers, how would you include attribution information without making the bulletin feel political?
한 줄 요약 (Korean summary). 극한기상을 직접 겪으면 사람들이 기후행동에 나설까? 스위스·독일 연구진은 미국 성인 1,451명에게 실제 탄소배출이 걸린 선택 실험을 했다(Nature Climate Change 등록보고서). 참가자는 보너스를 더 받는 대신 탄소를 더 배출하는 선택지와, 보너스를 덜 받는 대신 탄소를 덜 배출하는 선택지 중 하나를 골랐다. 연구진은 이 선택을 각자가 사는 카운티에 최근 30일간 기록된 극한기상(NOAA 자료)과 연결해 분석했다. 민주당 지지자는 공화당 지지자보다 돈을 덜 받더라도 탄소배출이 적은 쪽(저탄소 선택)을 고르는 경우가 뚜렷이 많았다. 그 차이는 선택하기 전 정보를 살펴보는 단계에서부터 나타나, 민주당 지지자가 탄소 정보를 더 오래 들여다보았다. 반면 실제로 기록된 극한기상 노출은 탄소 정보에 대한 주의도, 저탄소 선택도 늘리지 않았고 당파 간 차이도 키우지 않았다. 오히려 공화당 지지자가 극한기상에 조금 더 자주 노출되었는데도, 겪었다고 보고한 경험은 민주당 지지자가 더 많았다. 결정적인 것은 해석이었다. 극한기상을 기후변화의 결과로 받아들이는 사람일수록 탄소 정보에 더 주의를 기울이고 저탄소 선택을 더 많이 했다. 관측된 재해와 사람들이 경험하는 재해는 서로 다른 양이다. 재해가 저절로 사람들을 설득해 주기를 기다리기보다, 사건의 원인(기후변화 기여도)을 함께 설명하는 기후서비스와 소통이 중요하다.
References
Wyss, A. M., Guizar Rosales, E. T., Schulte-Mecklenbeck, M., Buchs, J., Hahnel, U. J. J., & Knoch, D. (2026). Political affiliation impacts climate attention and choice beyond extreme weather exposure. Nature Climate Change. https://doi.org/10.1038/s41558-026-02765-z
Ogunbode, C. A., Demski, C., Capstick, S. B., & Sposato, R. G. (2019). Attribution matters: Revisiting the link between extreme weather experience and climate change mitigation responses. Global Environmental Change, 54, 31–39. https://doi.org/10.1016/j.gloenvcha.2018.11.005
Hazlett, C., & Mildenberger, M. (2020). Wildfire exposure increases pro-environment voting within Democratic but not Republican areas. American Political Science Review, 114(4), 1359–1365. https://doi.org/10.1017/S0003055420000441
Cologna, V., Meiler, S., Kropf, C. M., et al. (2025). Extreme weather event attribution predicts climate policy support across the world. Nature Climate Change, 15, 725–735. https://doi.org/10.1038/s41558-025-02372-4
Moore, F. C., Obradovich, N., Lehner, F., & Baylis, P. (2019). Rapidly declining remarkability of temperature anomalies may obscure public perception of climate change. Proceedings of the National Academy of Sciences, 116(11), 4905–4910. https://doi.org/10.1073/pnas.1816541116
Both figures are original. The Python scripts that produce them are available on GitHub: Figure 1 and Figure 2.