Will the Atlantic overturning tip, and how fast would we feel it?
Every few months, a headline warns that the Gulf Stream is about to “shut down.” Many readers picture the film The Day After Tomorrow, where New York freezes in a week. The real science is less cinematic but no less serious. Two recent papers from the Utrecht group of Henk Dijkstra and René van Westen give a good picture of where things stand. The first is a review of how likely a collapse is this century (Dijkstra & van Westen 2026). The second is a new modelling study showing that the speed of warming may matter more than its final level (van Westen, Börner & Dijkstra 2026).
In this post I read the two papers as a diagnosis: what we know about the patient now, what could go wrong, and above all how fast. When students ask me about this topic, the question behind the question is usually: is this something sudden, or something people would only feel slowly over a long time? The short answer is that it is both, on different clocks. The rest of this post explains what that means.
What the AMOC is, and why a hydrologist should care
The Atlantic Meridional Overturning Circulation (AMOC) is the large loop of the Atlantic Ocean in which warm, salty surface water flows north, gives up its heat to the atmosphere, becomes dense enough to sink in the northern North Atlantic, and returns south at depth. Its strength is measured in sverdrups (1 Sv = one million cubic metres per second). At about 17 Sv, it moves roughly fifteen times the combined discharge of all the world’s rivers. At 26°N it carries about 1.5 petawatts of heat northward, which is a large part of the reason north-western Europe is so mild for its latitude.
The reason the AMOC can “tip” is a feedback any water engineer will recognize as a positive feedback loop. The overturning brings salt north. If the northern Atlantic becomes fresher (from more rain, river runoff, sea-ice melt or Greenland meltwater), the surface water becomes lighter, sinks less, and the weaker circulation delivers less salt. This freshens the surface further. Beyond a critical point, the loop can run away and the circulation settles into a much weaker state. Physicists call this the salt-advection feedback, and it is why the AMOC can have two stable states rather than one.
Diagnosis 1: what the observations say
Direct, continuous measurements are surprisingly recent. The RAPID array at 26°N has been running only since 2004. Over 2004–2024 it shows a mean strength of about 16.9 ± 1.2 Sv, with a decline from 2005 to 2012 and a partial recovery afterwards. Arrays further north (OSNAP at 53–57°N and NOAC at 47°N) give similar values of about 17 Sv.
Longer records are indirect, and they do not agree with one another:
- A sea-surface temperature “fingerprint” (the cold patch south of Greenland, which has warmed less than the rest of the ocean) suggests the AMOC has weakened by about 3 Sv since 1950. Proxy records suggest it may now be at its weakest in more than a thousand years.
- Hydrographic sections show no long-term decline over 1982–2016. A recent reconstruction from air–sea heat fluxes finds no weakening at 26°N since the 1960s.
Verdict: there is no clear observational evidence that a collapse has started. There is also no evidence that would rule one out. Twenty years of direct data is a short record for a system whose natural variability spans decades.
Diagnosis 2: what the models say, and why they are probably too optimistic
The IPCC’s Sixth Assessment Report projects that the AMOC will weaken during this century under every emission scenario, with most CMIP6 models giving a 34–45% decline by 2100. It also states, with medium confidence, that there will be no abrupt collapse before 2100.
The review explains why that reassurance should be read carefully. The climate models used by the IPCC have well-known biases that make their AMOC too stable. The most important is the freshwater carried by the overturning across 34°S, a quantity called FovS. Its sign is a useful indicator of whether the AMOC sits in the regime where a collapsed state is possible. Observations and ocean reanalyses put FovS in that regime, but very few CMIP6 models reproduce both the observed FovS and the observed AMOC strength. Many also have overturning cells that are too shallow and carry too little heat.
The Utrecht group’s own model illustrates the problem. To make the AMOC collapse in their version of the Community Earth System Model (CESM), they had to add freshwater at about 65 times the present-day melt rate of the Greenland Ice Sheet. They interpret this not as a sign that the real AMOC is safe, but as a sign that the model is biased. In their words, the real AMOC is probably closer to a tipping point, and the extra freshwater should be thought of as a bias correction.
What about the probability of a collapse? The honest answer from the review is that no adequate estimate exists yet. One widely reported statistical study put the onset of collapse at 2057, with a 90% range of 2025–2095 (Ditlevsen & Ditlevsen 2023), but other researchers have shown that the temperature data used to reconstruct the AMOC carry uncertainties too large for such a prediction. Early-warning indicators based on rising variance are known to give false alarms. A simple box model gives a probability of about 15% for a noise-driven transition, but only within that model.
The review makes one more point that engineers will appreciate: because the impacts are so large, even a probability as small as 10−4 matters. We design dam spillways for floods with an annual probability of 1 in 10,000. A climate system with a similar chance of a severe failure deserves the same seriousness.
Diagnosis 3: it is the speed, not only the level
The commonly cited warming threshold for an AMOC collapse is about +4 °C, with a range of 1.4–8 °C. The new Nature Climate Change paper argues that this number may not mean much, because the AMOC’s stability depends on how fast the climate is forced, not on a fixed temperature.
The authors increased CO₂ in the CESM linearly at three rates, all the way to four times the pre-industrial level:
- at +0.5 ppm per year, the AMOC stayed strong even when global warming reached +5.5 °C;
- at +2.5 and +5.0 ppm per year, it began to collapse at about +2.0 °C.
For comparison, CO₂ at Mauna Loa rose by about +2.6 ppm per year on average in 2015–2025. In this model, today’s rate falls on the wrong side of the line.
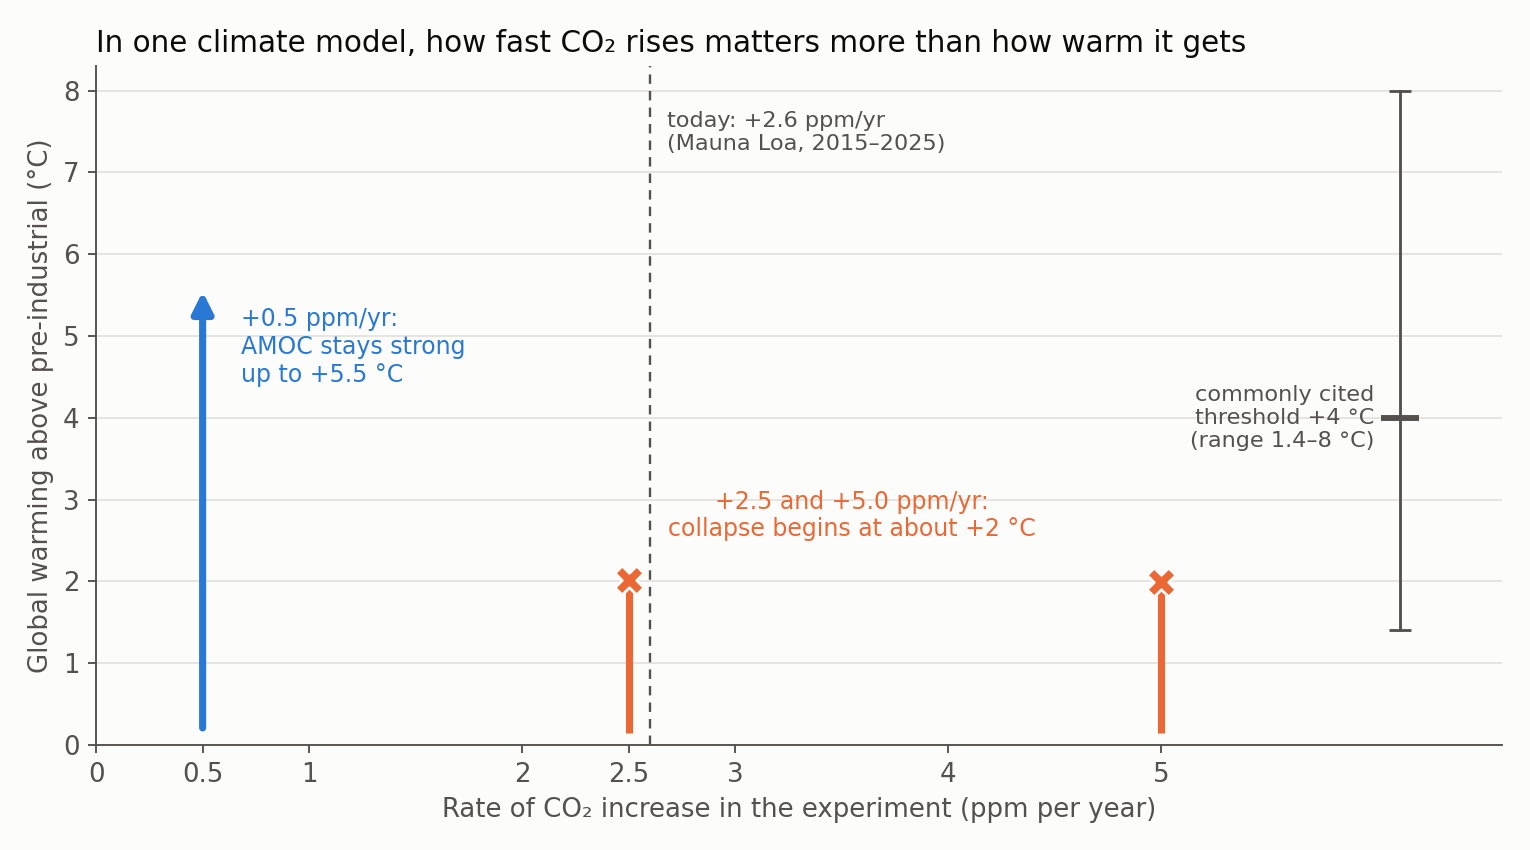
Figure 1. Global warming at which the AMOC began to collapse in three CO₂-ramp experiments with one climate model (CESM, with a freshwater bias correction of 0.45 Sv). Under the slowest ramp the AMOC did not collapse, even at +5.5 °C. The dashed line marks the observed rate of CO₂ increase. The bar on the right is the commonly cited warming threshold and its range. Figure by Daeha Kim, drawn from numbers reported in van Westen, Börner & Dijkstra (2026).
Why should the rate matter? When the forcing is slow, the deep ocean has time to adjust together with the surface. In a warmer climate, evaporation over the Atlantic increases and there is less North Atlantic sea ice, so less meltwater is released into the sinking region. Both effects make the Atlantic saltier and help keep the circulation going. When the forcing is fast, the surface water becomes lighter much faster than the interior can follow, the pathways by which water sinks shut down, and the circulation collapses before these stabilizing effects can act.
Hydrologists know this logic well. The same storm total can produce no runoff when it falls as gentle rain over a week, and a flood when it falls in an hour, because infiltration cannot keep up. It is the intensity, not only the depth, that decides.
The same model under standard emission scenarios tells a consistent story. Under a low-emission pathway (RCP2.6) the AMOC weakens and then recovers. Under moderate emissions (RCP4.5) collapse begins around 2110, at +2.2 °C. Under high emissions (RCP8.5) it begins around 2060, at +2.8 °C. The authors combine these results with CMIP6 analyses and estimate a critical warming rate of about 0.29 °C per decade. This lies within the 0.27–0.36 °C per decade projected for the coming decades. Their conclusion is direct: cutting emissions quickly is what reduces the risk.
What a collapse would do
The cleanest way to study the impacts is to collapse the AMOC in a model run without global warming, so that the AMOC signal is not mixed with everything else. In the CESM, the results include:
- North-western Europe gets much colder. Sea-surface temperatures near western Europe drop by as much as 10 °C. Over a broad region, annual-mean air temperature falls by more than 1 °C per decade, and several European cities cool by 5–15 °C. Arctic sea ice in March extends as far south as about 50°N, and the extra ice reflects more sunlight, amplifying the cooling.
- The Southern Hemisphere warms. Less heat is carried north, so the two hemispheres move in opposite directions (the “bipolar seesaw”).
- Sea level rises along Atlantic coasts. A weaker circulation changes the slope of the sea surface, and some coastal regions see more than 70 cm of additional dynamic sea-level rise, on top of the global rise from warming.
- Tropical rain belts shift south. The Intertropical Convergence Zone (ITCZ) moves southward and the Northern Hemisphere Hadley cell strengthens. In the Amazon, the dry season and the wet season trade places.
In a warming world, part of the European cooling would be offset by greenhouse warming, so the temperature numbers above are an upper picture. The sea-level signal, however, looks similar regardless of when the collapse happens. Outside Europe, the review notes that significant changes appear mainly in particular months, not across the whole year. For East Asia, including Korea, the regional details are still model-dependent, so I will not pretend to more precision than the papers give.
From a water perspective, the ITCZ shift is the part that worries me most. The tropical rain belt feeds some of the world’s largest rivers and supports the agriculture of hundreds of millions of people. A shift of the seasons, rather than a change in the annual total, is exactly what our reservoir rules, irrigation calendars and flood seasons are not designed for. It would also mean that the statistics we use to design infrastructure would stop describing the future, a problem hydrologists summarize as “stationarity is dead.”
So, sudden or gradual? Three clocks
Here is my answer to the students’ question. An AMOC collapse runs on three clocks with very different speeds.
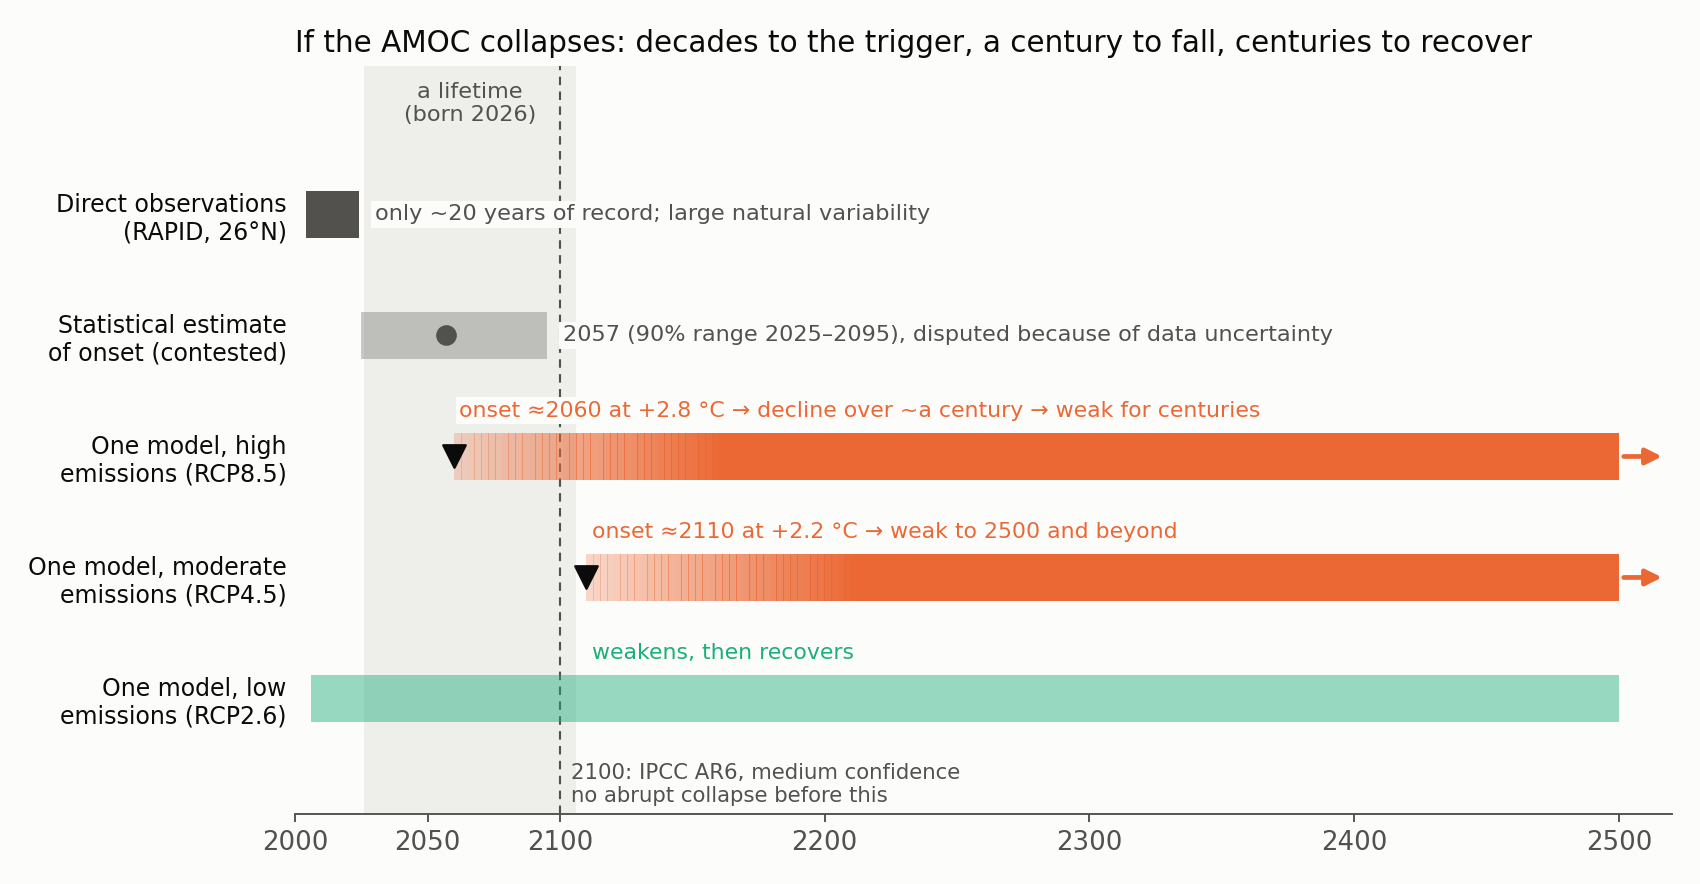
Figure 2. Timescales involved in a possible AMOC collapse. The grey rows show the short observational record and a contested statistical estimate of collapse onset. The coloured rows show one climate model (CESM, bias-corrected) under three emission scenarios: triangles mark collapse onset, the fading bars show the decline over about a century, and the solid bars show the persistent weak state. This is a schematic of published numbers, not a forecast. Figure by Daeha Kim, based on Dijkstra & van Westen (2026), van Westen, Börner & Dijkstra (2026) and Ditlevsen & Ditlevsen (2023).
Clock 1: the trigger (now to the next few decades). Whether a collapse starts is decided by what we emit, and how fast, over the next few decades. In the one model that has been pushed hardest, onset comes in the second half of this century or early next. The IPCC considers an abrupt collapse before 2100 unlikely, but that judgement rests on models that are probably too stable. Nobody can yet give a reliable probability.
Clock 2: the fall (about a century). Once a collapse begins, the circulation declines over roughly a hundred years. That rules out the Day After Tomorrow picture. Nothing freezes overnight, and from one year to the next the change would be smaller than ordinary weather variability. Yet by the standards of climate it is fast. A cooling trend of more than 1 °C per decade in north-western Europe is about four times faster than today’s global warming, and in the opposite direction. People would not feel a shock, but over a working career they would see a clear trend, much as we see global warming today. A child born this year could live through most of the decline.
Clock 3: the memory (centuries). A collapsed AMOC does not come back when emissions stop. In the CESM runs, the AMOC is still very weak in 2500, and the authors note that even if it eventually recovered, its impacts would last for at least about 300 years. Conceptual models suggest an asymmetry: a collapse can be set off relatively quickly, but recovery needs the North Atlantic to be slowly made saltier again. On any human timescale, a collapse would be permanent.
There is one more, uncomfortable timing problem. Because the direct record is short and natural variability is large, we would probably recognize a collapse only after it was well under way, and by then it would already be locked in. The decision has to be made before the evidence is conclusive. It is the same lesson as in my earlier post on overshooting 1.5 °C: the consequences arrive long after the causes, so waiting for certainty is itself a choice.
Bottom line
- Current state: the AMOC is about 17 Sv, with no clear sign that a collapse has begun, but only about 20 years of direct data and conflicting indirect evidence.
- Risk: probably underestimated, because the models used by the IPCC tend to make the AMOC too stable. No reliable probability exists, and even small probabilities matter.
- Main control: the rate of warming. In one model, the current rate of CO₂ increase is fast enough to cause a collapse at about +2 °C, while a much slower rise does not cause one even at +5.5 °C.
- Timescale: decades to the trigger, about a century to fall, centuries to recover. A collapse would be gradual enough to feel like a trend, fast enough to outrun adaptation, and lasting enough to be permanent for us.
Questions to think about
- The salt-advection feedback is a positive feedback. Can you name a positive feedback in a catchment or a river channel, and what keeps it from running away?
- Why might the same total amount of warming be safe when it is slow and dangerous when it is fast? Try explaining it using infiltration-excess runoff.
- If you were designing a coastal drainage system on the US East Coast with a 100-year design life, how would you treat a low-probability, high-impact scenario such as an extra 70 cm of dynamic sea-level rise?
한 줄 요약 (Korean summary). 대서양 자오선 순환(AMOC)은 현재 약 17 Sv로, 붕괴가 시작되었다는 뚜렷한 관측 증거는 없지만 직접 관측 기록은 20년 남짓에 불과하다. IPCC는 2100년 이전의 급격한 붕괴 가능성을 낮게 보지만, 기후모델들은 AMOC를 실제보다 안정적으로 모의하는 경향이 있어 위험이 과소평가되었을 가능성이 크다. 최신 연구에 따르면 붕괴 여부는 도달하는 온도보다 온난화 속도에 좌우된다: 한 모델에서 CO₂가 연 0.5 ppm씩 오르면 +5.5 °C에서도 버텼지만, 연 2.5 ppm 이상(현재는 연 2.6 ppm)에서는 약 +2 °C에서 붕괴가 시작되었다. 붕괴하면 북서유럽이 10년에 1 °C 이상 냉각되고, 대서양 연안 해수면이 최대 70 cm 이상 추가로 오르며, 열대 강우대가 남쪽으로 이동해 아마존의 건기와 우기가 뒤바뀐다. 시간 규모로 보면 붕괴가 시작될지는 향후 수십 년의 배출이 결정하고, 붕괴 자체는 약 100년에 걸쳐 진행되며(하룻밤에 일어나는 일은 아니지만 한 사람의 일생 동안 분명히 느낄 만큼 빠르다), 그 영향은 수백 년간 지속된다. 관측으로 확인될 즈음에는 이미 되돌리기 어려울 가능성이 크므로, 확실한 증거를 기다리기보다 배출을 빨리 줄이는 것이 핵심이다.
References
Dijkstra, H. A., & van Westen, R. M. (2026). The probability of an AMOC collapse onset in the twenty-first century. Annual Review of Marine Science, 18, 23–46. https://doi.org/10.1146/annurev-marine-040324-024822
van Westen, R. M., Börner, R., & Dijkstra, H. A. (2026). Failure to track a stable AMOC state under rapid climate change. Nature Climate Change, 16, 1195–1206. https://doi.org/10.1038/s41558-026-02730-w
Ditlevsen, P., & Ditlevsen, S. (2023). Warning of a forthcoming collapse of the Atlantic meridional overturning circulation. Nature Communications, 14, 4254. https://doi.org/10.1038/s41467-023-39810-w
Ben-Yami, M., Morr, A., Bathiany, S., & Boers, N. (2024). Uncertainties too large to predict tipping times of major Earth system components from historical data. Science Advances, 10, eadl4841.
Caesar, L., McCarthy, G. D., Thornalley, D. J. R., Cahill, N., & Rahmstorf, S. (2021). Current Atlantic Meridional Overturning Circulation weakest in last millennium. Nature Geoscience, 14, 118–120.
Terhaar, J., Vogt, L., & Foukal, N. P. (2025). Atlantic overturning inferred from air-sea heat fluxes indicates no decline since the 1960s. Nature Communications, 16, 222.
IPCC (2021). Summary for Policymakers. In Climate Change 2021: The Physical Science Basis. Cambridge University Press.
Both figures are original. The Python scripts that produce them are available on GitHub: Figure 1 and Figure 2.