Approaching 1.5°C from above
For most of my career, 1.5°C was a line we were trying not to cross. That framing is about to expire. Human-induced warming is now close to 1.4°C above pre-industrial levels and rising by roughly a quarter of a degree per decade. The United Nations Environment Programme’s new report, Limiting Overshoot: Navigating exceedance of 1.5°C and pathways towards return (UNEP 2026), starts from a blunt premise: 1.5°C will be exceeded within the next few years. The question is no longer whether we cross it, but how far past it we go, how long we stay there, and whether we can come back.
The report’s short answer is that the goal stays the same, but we now have to approach it from above. Here are the messages I think matter most, followed by what they mean for those of us who design and manage water systems.
1. Overshoot is a pathway with stages, not a single event
The report describes an “overshoot, peak and decline” pathway in four stages: exceedance (warming passes 1.5°C), peak (warming stops rising once net CO₂ emissions reach zero), decline (warming falls slowly, only if the world removes more CO₂ than it emits for decades), and stabilization. Matching these, it proposes three overlapping response phases:
- Immediate response: cut emissions fast, especially methane and other short-lived pollutants, and protect the most vulnerable people and ecosystems now.
- Coping and containment: reach at least net-zero emissions to stop the rise, and manage severe impacts while temperatures peak.
- Long-term resilience: sustain net-negative CO₂ emissions to bring temperatures down, and adapt where losses have become permanent.
The report stresses that this is not a preferred or acceptable pathway. It is simply the best option still on the table. There are no benign scenarios above 1.5°C.
2. Every five years of delay adds about 0.1°C to the peak
The most quantitative message is also the simplest. Warming scales almost linearly with cumulative CO₂ emissions, so the peak temperature is set by how much CO₂ we emit before reaching net zero. The report puts the remaining budget for a 50% chance of 1.5°C at only about 130 GtCO₂ from 2026, against current emissions of about 40 GtCO₂ per year. At that rate the budget is gone in roughly three years. Staying within it would require emissions to fall in a straight line to zero in just over six years.
Because about 220 GtCO₂ produces 0.1°C of warming (the IPCC best estimate), every five years of emissions at today’s level adds roughly 0.1°C to whatever peak we eventually reach. The figure below is my own back-of-the-envelope version of that arithmetic. It is not a figure from the report.
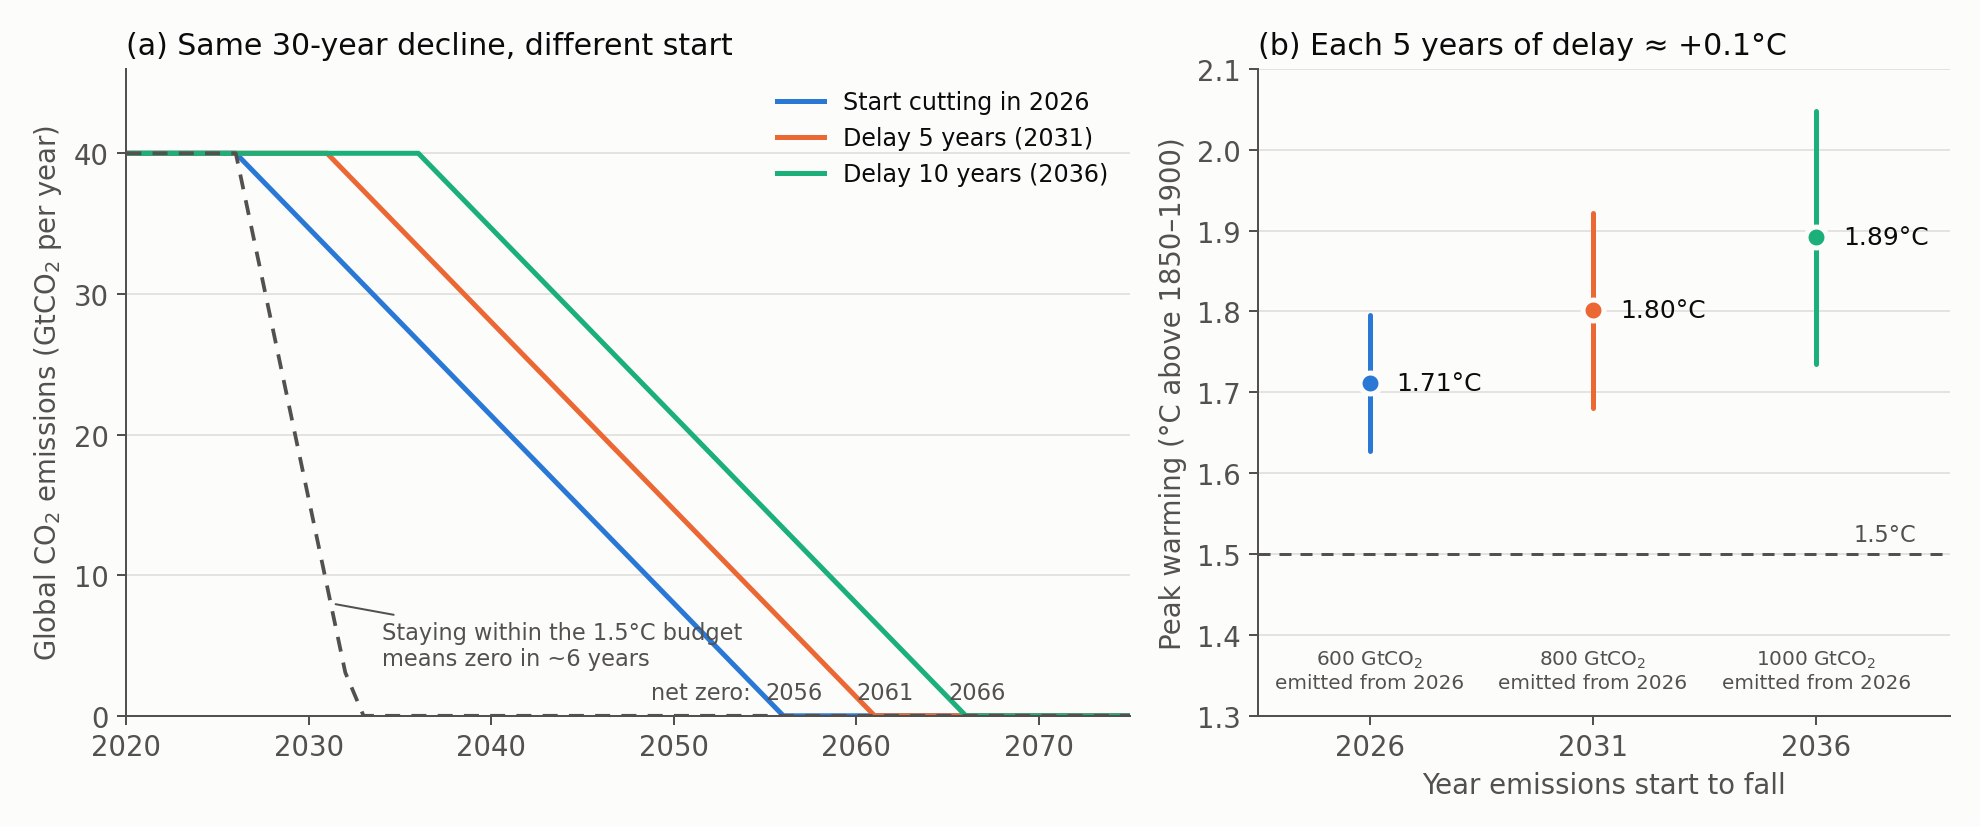
Figure. (a) Three idealized CO₂ pathways that all take 30 years to fall from 40 GtCO₂ per year to net zero, starting in 2026, 2031 or 2036. The dashed line is what staying within the 1.5°C budget would require. (b) The resulting peak warming, computed as 1.5°C plus the warming from CO₂ emitted beyond the 130 GtCO₂ budget, using the IPCC AR6 transient climate response to cumulative emissions (best estimate 0.45°C per 1000 GtCO₂; bars show the likely range of 0.27–0.63). Non-CO₂ gases and CO₂ removal are held fixed, so this is an illustration of the budget logic, not a projection. Figure by Daeha Kim, based on numbers reported in UNEP (2026).
Even the prompt-start case peaks at about 1.7°C. That is consistent with the report’s estimate that full implementation of every current national pledge and net-zero target still implies a peak of around 1.8°C. Each delay of five years pushes the peak up by another tenth of a degree.
3. Coming back down is slow, limited and uncertain
Returning below 1.5°C requires the world to become net-negative: removing more CO₂ than it emits, for decades. The report is sober about how hard that is:
- Even optimistic scaling of carbon dioxide removal is unlikely to lower temperatures by more than a few tenths of a degree this century.
- At today’s scale, afforestation and forest management would take over a century to reverse just 0.1°C of warming, and that assumes zero residual CO₂ emissions.
- Geological storage is finite. Merely maintaining net-zero CO₂ could use up the estimated storage capacity of sedimentary basins by around 2200.
- Once the peak exceeds about 1.8°C, a return to 1.5°C within this century becomes increasingly difficult.
The conclusion is that removal is needed in addition to deep emission cuts, never instead of them. The cheapest tenth of a degree is the one we never emit.
4. Some damage does not reverse when the temperature does
Bringing temperatures down helps, but the climate system has long memory. Glaciers could lose more than a quarter of their mass by 2100, and glacier loss will continue for centuries even if warming stabilizes. Sea level keeps rising long after the peak. Even so, a pathway that declines rather than stabilizing at a higher level could reduce sea-level rise by almost half a metre by 2300. Species extinctions and some ecosystem shifts, such as the loss of coral reefs, may not be undone at all. The report’s message to decision-makers is that the legacy of the peak is inherited by every stage that follows.
What this means for water
Reading the report as a hydrologist, three points stand out.
Our design assumptions have a new shape. Almost twenty years ago, Milly and colleagues argued that “stationarity is dead,” meaning that we can no longer design water infrastructure as if the past climate will repeat. Overshoot adds a twist. The climate we design for is not just moving. It may rise, peak and then partly fall within the lifetime of a single dam, levee or water supply system. A reservoir rule curve or design flood that is right for the peak may be wrong for the decline. The report explicitly calls for infrastructure that favours robustness and safety margins over optimization, and for forward-looking stress tests instead of planning from the historical record.
Water availability can change non-linearly. In glacier-fed basins, meltwater first rises as glaciers shrink, then falls as they disappear. A study cited in the report suggests that if temperatures decline after the peak and glaciers partly regrow, downstream runoff could drop further still, into what the authors call “trough water.” For communities that rely on seasonal meltwater, the decline stage is not automatically a recovery.
Adaptation has to be iterative. Because the path, the peak and the timing are all uncertain, the report argues that adaptation must be revisited repeatedly rather than designed once. This is the reasoning behind the decision-centric and scenario-neutral approaches my group has used to assess dams and river basins: start from the thresholds at which a system fails, then ask how plausible those conditions are under many possible futures, instead of betting on a single projection.
The bottom line
The report closes on a point worth repeating: overshoot is an argument for urgency, not resignation. Every fraction of a degree avoided and every year by which overshoot is shortened reduces risk to people, ecosystems and the infrastructure we build. For students thinking about a career in hydrology and water resources, this is the problem your generation will manage: water systems built for one climate, operated through another and possibly handed on in a third.
Questions to think about
- If a 100-year design flood is estimated for the peak-warming period, how should it be revised during the decline stage?
- Which water infrastructure in Korea has a design life that will span exceedance, peak and decline?
- Using the budget arithmetic in the figure, how much later could emissions start to fall if the target were a 1.8°C peak instead?
한 줄 요약 (Korean summary). 지구 온난화는 몇 년 안에 1.5°C를 넘어설 전망이며, UNEP 보고서는 이제 1.5°C 목표에 “위로부터” 접근해야 한다고 강조한다. 감축이 5년 늦어질 때마다 최고 기온은 약 0.1°C 높아지고, 대기 이산화탄소를 흡수해 저장하는 제거(CDR) 기술로 되돌릴 수 있는 온도는 이번 세기 안에 수십 분의 1°C 정도에 그친다. 기후가 오르고, 정점을 찍고, 다시 내려가는 과정 전체를 견딜 수 있도록 기후관련 인프라를 설계하고 적응 전략을 지속적으로 수정해 나가야 한다.
Reference
United Nations Environment Programme (2026). Limiting Overshoot: Navigating exceedance of 1.5°C and pathways towards return. Nairobi. https://doi.org/10.59117/20.500.11822/49857
Milly, P. C. D., et al. (2008). Stationarity is dead: Whither water management? Science, 319, 573–574. https://doi.org/10.1126/science.1151915
The figure is an original illustration. The Python script that produces it is available on GitHub.