Heat-stressed workers add about $41 to the social cost of carbon
How much damage does one more ton of CO₂ do? Economists answer with the social cost of carbon: the present value of all future harm caused by emitting one extra ton today. It is the number behind carbon prices, cost–benefit analyses of regulations and some infrastructure decisions, so what goes into it matters.
Until now, one obvious harm was missing. When it is hot and humid, people work more slowly and take more breaks, and outdoor workers in particular lose hours. A study in Nature Climate Change led by Frances Moore puts a price on this lost productivity for the first time within a modern framework for the social cost of carbon, and at the same time revises the estimate for agriculture (Moore et al. 2026). The two changes nearly cancel, but they change what the number is made of.
Heat stress is about humidity, not only temperature
The authors measure heat stress with the wet-bulb globe temperature (WBGT), the standard metric for workplace safety. WBGT combines air temperature and sunlight, which heat the body, with humidity and wind, which control how well sweat can cool it. A hot, dry day can be safer for a worker than a slightly cooler, humid one.
They computed WBGT every three hours on a 0.25° grid from 15 bias-corrected climate models, then translated it into lost productivity using two response functions that act as upper and lower bounds. One is based on the international standard (ISO) for how much rest workers need at a given WBGT and work intensity. The other, used by the Lancet Countdown, is based on field observations of rice harvesters in India and miners in South Africa. Productivity loss was calculated separately for indoor and outdoor work at three levels of effort, with indoor exposure adjusted for how common air conditioning is in each country (from 0% in South Sudan to 90% in Japan).
Although WBGT rises most at high latitudes, the losses concentrate where it is already close to physiological limits: South and Southeast Asia, West Africa and the Amazon. Construction, with its heavy outdoor work, is hit hardest. These productivity losses were then fed into a global economic model, which lets production, trade and consumption adjust, before entering the calculation of the social cost of carbon.
The results
Labour costs about US\$41 per ton of CO₂. For a ton emitted in 2025 (in 2020 dollars, with a 2% discount rate), the mean labour damage is US\$41, with a median of US\$32 and a 90% range from US\$1 to US\$108 (Figure 2a). The ISO function alone gives US\$52, the Lancet function US\$30. An independent working paper using a completely different method, based on observed weekly working hours, arrived at a similar US\$39. Labour is now the second-largest component of the social cost of carbon, after heat-related deaths (US\$98) and ahead of the other sectors.
The burden falls on hot, humid, populous countries. India alone accounts for about US\$9 of the US\$41, followed by Nigeria (US\$6), China (US\$4) and Pakistan (US\$3) (Figure 2b). Per person, the damages are largest in Gulf states such as Qatar and the United Arab Emirates and in sub-Saharan Africa. With the ISO function, at 3°C of warming above 1995–2015, South Asia loses more than 6% of its income through heat-related labour losses alone, while Europe’s losses are negligible.
Agriculture costs less than thought. The previous estimate of agricultural damages relied on about 1,000 crop-yield projections from 56 studies compiled for the IPCC’s Fifth Assessment Report. The update uses 8,703 projections from 202 studies compiled for the Sixth. With this much larger evidence base, projected yield losses at high warming are smaller and much less uncertain. Agricultural damages fall from US\$95 to US\$29 per ton, and the 95th percentile drops by US\$260.
The total barely moves, but becomes more certain. Adding labour and revising agriculture lowers the mean social cost of carbon from US\$204 to US\$179 per ton (Figure 1). The long upper tail shrinks, and the probability that the true value is zero or negative falls from 0.6% to below 0.008%.
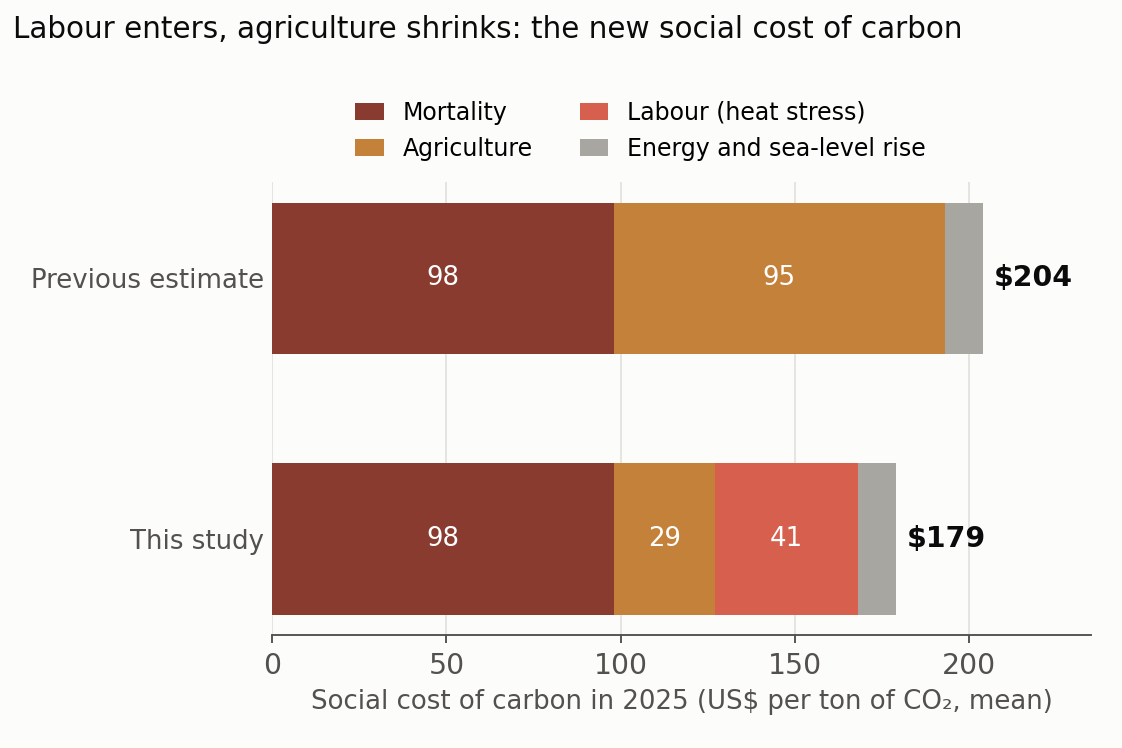
Figure 1. Mean social cost of carbon for a ton of CO₂ emitted in 2025 (2020 US dollars, 2% near-term discount rate), by damage sector, in the previous version of the GIVE model and in the revised version. Energy and sea-level rise are unchanged and shown as the remainder. Figure by Daeha Kim, drawn from numbers reported in Moore et al. (2026).
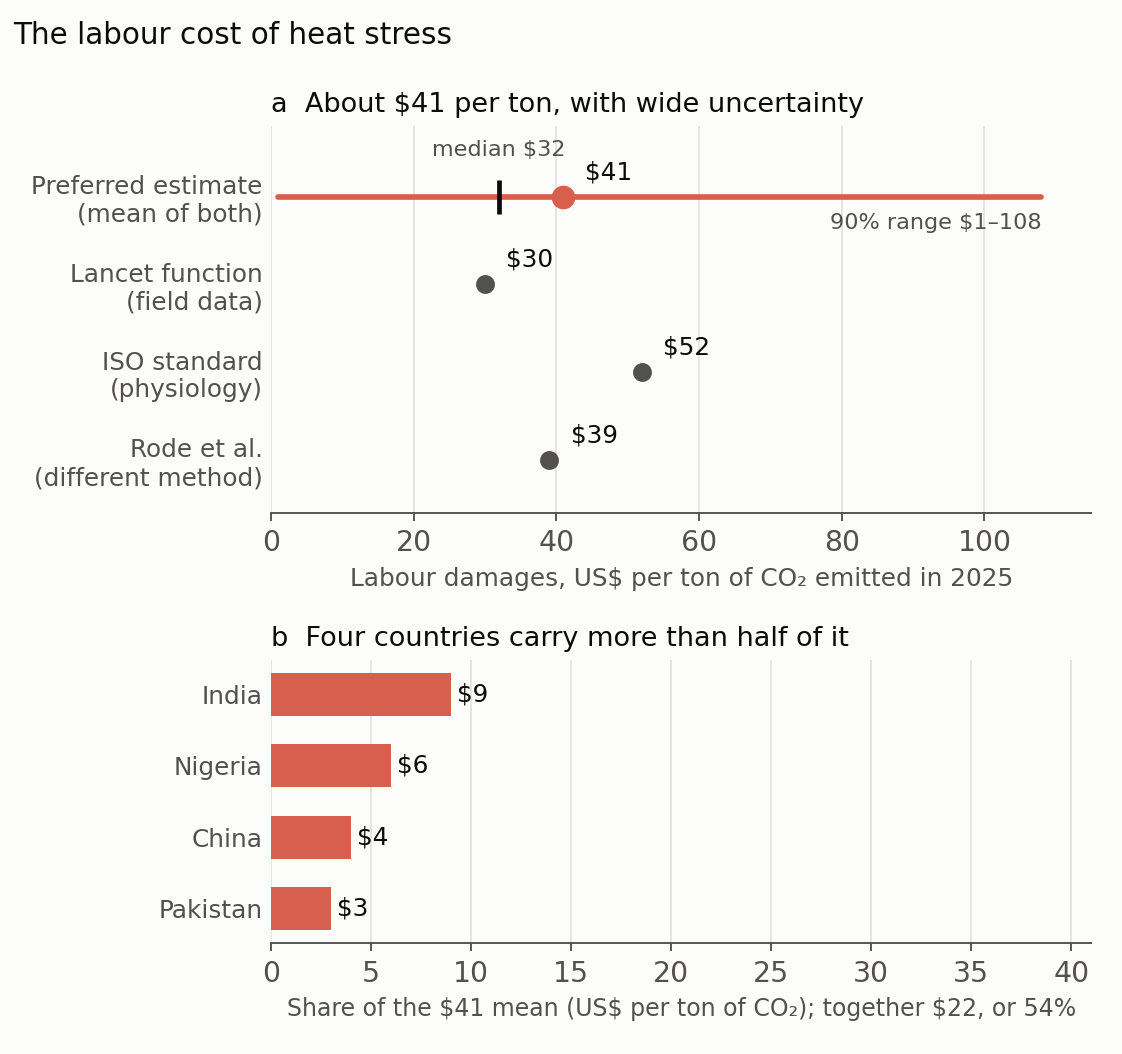
Figure 2. (a) Labour component of the 2025 social cost of carbon: the preferred estimate (mean, median and 90% range), the estimates using each response function alone, and an independent estimate by Rode et al. using a different method. (b) The four countries with the largest contributions. Figure by Daeha Kim, drawn from numbers reported in Moore et al. (2026).
What the numbers do and do not include
The authors are explicit about what could push the estimate up or down.
- Cold benefits are not counted. Warmer winters might help some outdoor workers, but evidence suggests this effect is small.
- Adaptation is partly included. The economic model shifts work to cooler hours of the day, moves production between sectors and regions, and substitutes machines for labour. It does not include the future spread of air conditioning, or changes such as shading construction sites, which would lower the cost, though not for free.
- Health costs are only partly covered. Heat deaths are counted elsewhere in the social cost of carbon, but heat-related illness and injury are not.
- Agriculture covers only four crops. Wheat, rice, maize and soybeans account for about half of cropped area; other crops, meat and dairy are not directly modeled.
Why this matters
The paper’s own conclusion is that a social cost of carbon near US\$200 per ton, the value adopted by the US Environmental Protection Agency in 2023, is well supported, and that a value of zero can be ruled out with high confidence. That is a pointed statement at a time when US federal guidance no longer monetizes climate damages in regulatory analysis.
There is also a quieter lesson about how such numbers improve. The agricultural estimate fell not because the climate risk disappeared but because the evidence base grew roughly eightfold and narrowed the uncertainty. The labour estimate rose because a real, well-documented harm was finally counted. Both changes come from better science, and they pull in opposite directions.
What a hydrologist takes from it
Humidity is a hydrological variable. Because WBGT depends on humidity, land and water management can change heat stress directly. Irrigation, for example, cools the surface but adds moisture to the air, and in India it has been shown to intensify humid heat extremes (Mishra et al. 2020). Decisions about irrigation therefore have consequences for the people who work in irrigated fields.
Wind matters for workers, too. In the previous post, wind sped up evaporation from ecosystems. In WBGT, wind does the same for the human body: it helps sweat evaporate. Calm, humid days are the most dangerous.
The losses follow the seasons. Even in the hottest regions, the thresholds that trigger productivity losses are crossed only during part of the year, and in agriculture those weeks often coincide with planting and harvest. Seasonal forecasts of humid heat could help farmers and builders plan around them.
Bottom line
Heat stress already slows workers, and climate change will make it worse, especially in hot, humid and populous regions of South Asia and Africa. Moore and colleagues estimate this cost at about US\$41 per ton of CO₂, making labour one of the largest components of the social cost of carbon. A better-supported agricultural estimate falls from US\$95 to US\$29, so the total settles near US\$180 per ton with much less uncertainty. Both revisions show that the social cost of carbon is not a fixed number but a running summary of what we know.
Questions to think about
- Two response functions, one physiological and one observational, give US\$52 and US\$30. Which would you trust more for Korean construction workers in July, and why?
- If expanding irrigation raises humid heat stress for farm workers, how would you weigh that against the yield benefits?
- Should a country’s own social cost of carbon count damages to workers in other countries? How would that change the number?
한 줄 요약 (Korean summary). 탄소의 사회적 비용(SC-CO₂)은 오늘 CO₂ 1톤을 더 배출했을 때 미래에 발생하는 모든 피해의 현재 가치로, 탄소 가격과 정책의 비용·편익 분석에 쓰인다. Moore 등(2026)은 그동안 빠져 있던 폭염에 따른 노동 생산성 손실을 처음으로 포함했다. 기온뿐 아니라 습도, 일사, 바람을 함께 반영하는 습구흑구온도(WBGT)를 15개 기후모델로 3시간·0.25° 해상도로 계산하고, ISO 기준과 현장 관측 기반의 두 반응함수, 각국의 에어컨 보급률, 세계 경제모형을 결합했다. 그 결과 2025년 배출 CO₂ 1톤당 노동 피해는 평균 41달러(90% 범위 1–108달러)로, 열 관련 사망(98달러) 다음으로 큰 항목이 되었다. 피해는 인도(9달러), 나이지리아(6달러), 중국(4달러), 파키스탄(3달러)처럼 덥고 습하며 인구가 많은 나라에 집중되고, 3°C 온난화 시 남아시아는 소득의 6% 이상을 잃지만 유럽의 손실은 미미하다. 반면 IPCC 6차 보고서의 훨씬 많은 작물 수확량 연구(202편, 8,703개 추정치)를 반영하자 농업 피해는 95달러에서 29달러로 줄었다. 두 변화가 거의 상쇄되어 전체 SC-CO₂는 204달러에서 179달러로 조금 낮아졌지만 불확실성은 크게 줄었고, 그 값이 0 이하일 확률은 0.008% 미만이다.
References
Moore, F. C., Haqiqi, I., Kong, Q., Rennels, L., Baldos, U., Ganapathi, H., Huber, M., & Hertel, T. (2026). New labour and agricultural damages improve climate cost estimates. Nature Climate Change, 16, 1170–1177. https://doi.org/10.1038/s41558-026-02749-z
Mishra, V., Ambika, A. K., Asoka, A., Aadhar, S., Buzan, J., Kumar, R., & Huber, M. (2020). Moist heat stress extremes in India enhanced by irrigation. Nature Geoscience, 13, 722–728. https://doi.org/10.1038/s41561-020-00650-8
Both figures are original. The Python scripts that produce them are available on GitHub: Figure 1, Figure 2.