Wind makes ecosystems spend more water for the same carbon
Ecosystems trade water for carbon. To take up CO₂ through their stomata, leaves have to let water vapor out, and the ratio between the two, the carbon gained per kilogram of water evaporated, is called water use efficiency (WUE). It is one of the most useful single numbers in ecohydrology. Rising WUE has usually been credited to rising CO₂, which lets plants narrow their stomata (Keenan et al. 2013), and to changes in temperature, sunlight and air dryness.
Wind has been mostly left out of that story. A new study in Nature Climate Change by Xiang Wang, Zheng Fu and colleagues brings it back (Wang et al. 2026). Using flux towers around the world and climate models, they show that on windier days, ecosystems use water less efficiently, and that the slow decline of winds over land in recent decades has been nudging WUE upward.
What they found
The authors used daily measurements of photosynthesis (gross primary productivity, GPP) and evapotranspiration (ET) from 146 eddy-covariance towers in the FLUXNET2015, AmeriFlux, ICOS and OzFlux networks. For each site they asked how WUE (GPP divided by ET) varied with wind speed during the growing season, after removing the effects of temperature, precipitation, sunlight, CO₂ and vapor-pressure deficit (VPD).
The answer was remarkably consistent. WUE fell significantly with wind at 79.5% of sites and rose significantly at only 5.5% (Figure 1a). The pattern held for almost every vegetation type and for different definitions of the growing season. Among all the drivers they examined, wind speed had the largest median standardized effect on WUE, ahead of sunlight, VPD and temperature.
On average, each additional meter per second of wind lowered WUE by about 0.26 grams of carbon per kilogram of water. The effect was strongest in evergreen needleleaf forests and in humid climates, and close to zero in arid climates (Figure 1b).
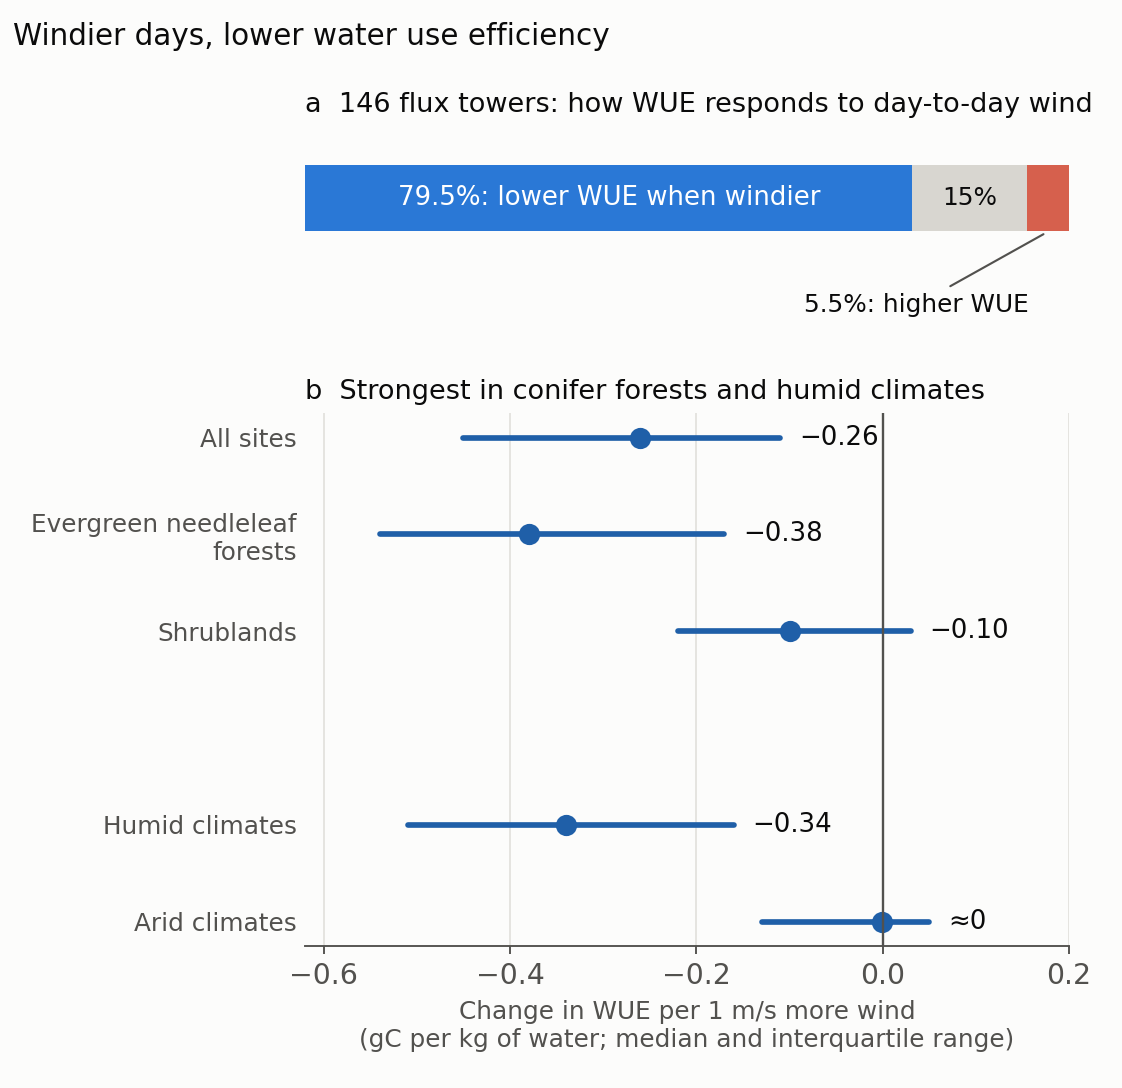
Figure 1. (a) Partial correlation between daily WUE and wind speed at 146 eddy-covariance sites during the growing season, after controlling for temperature, precipitation, CO₂, solar radiation and VPD. (b) Change in WUE per 1 m/s increase in wind speed (median and interquartile range) for all sites, two vegetation types and two climate classes. Figure by Daeha Kim, drawn from numbers reported in Wang et al. (2026).
Why: wind mostly speeds up evaporation
WUE can fall because carbon uptake drops or because water loss rises. Splitting the two, the authors found that wind acts mainly on the water side: its effect on ET was almost three times as large as its effect on GPP (standardized sensitivities of +0.11 and −0.04).
The mechanism is familiar to anyone who has used the Penman–Monteith equation. Wind thins the layer of still air around leaves and increases the aerodynamic conductance, the ease with which water vapor is carried away from the canopy. In the paper, wind changed aerodynamic conductance strongly (standardized sensitivity 0.66) but barely changed canopy conductance, which reflects how far the stomata are open (0.03). In other words, the plants did not open up; the air simply carried more water away. Windier days were also drier: wind and VPD were positively correlated at 67% of sites, and higher VPD lowered WUE at 70% of them. Wind also coupled the canopy more tightly to the atmosphere, so that transpiration responded more to air dryness and less to sunlight. GPP declined a little as well, probably because drier air makes leaves partly close their stomata and because strong winds stress plants mechanically.
Why conifer forests and humid places respond most
The strong effect in needleleaf forests has a neat physical explanation, which the authors mention and which a simple calculation makes vivid. Tall conifer canopies are aerodynamically rough, and in humid regions they are often wet with intercepted rain. Evaporation from a wet canopy is not limited by stomata at all, so it responds directly to how fast the wind removes vapor.
Figure 2 shows this with the Penman–Monteith equation under identical weather. For a dry canopy, going from 1 to 5 m/s of wind raises transpiration by about 20%, over both grass and forest. For a wet forest canopy, the same change more than triples evaporation. Wind therefore matters most where the canopy is rough and wet, which matches where the authors observed the largest effects.
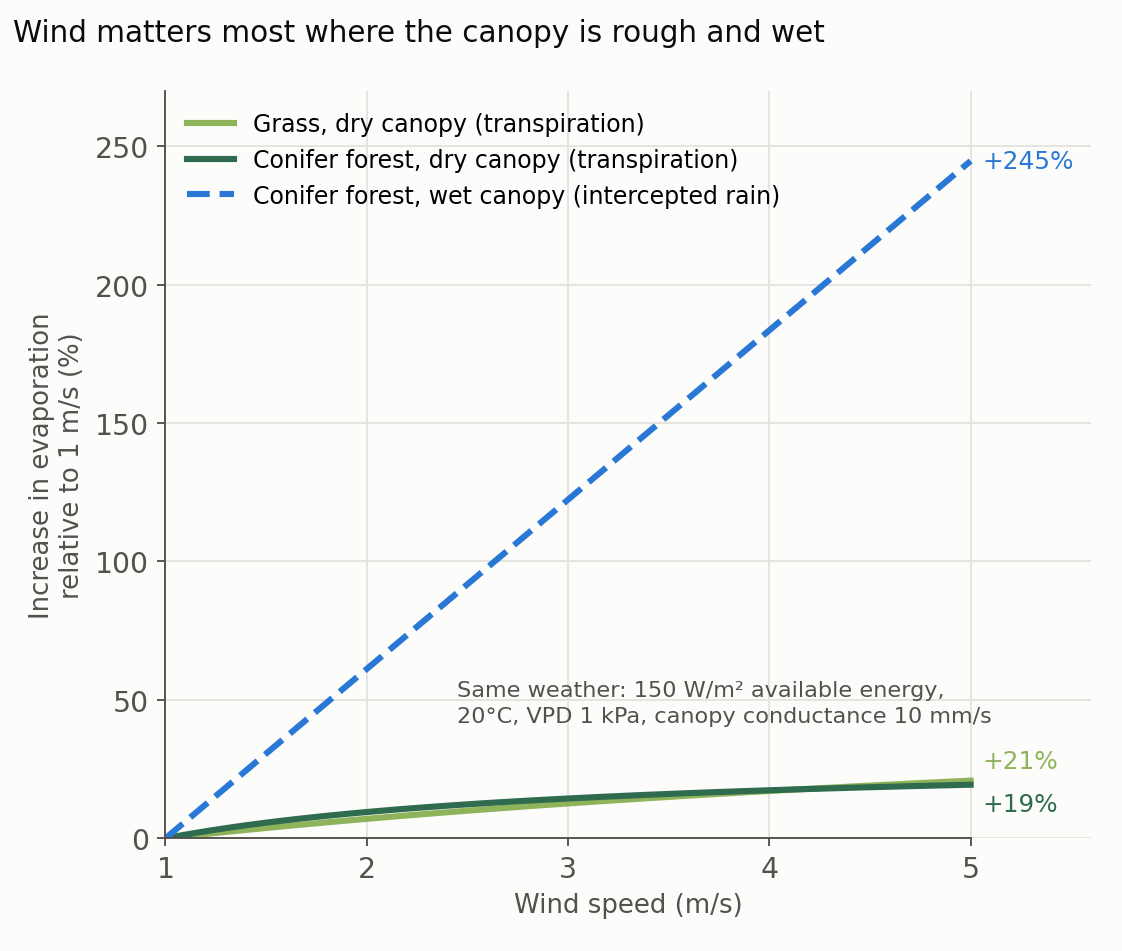
Figure 2. Increase in evaporation with wind speed, relative to 1 m/s, from the Penman–Monteith equation for a grass canopy and a 20 m conifer forest with the same canopy conductance (10 mm/s), and for the same forest when its canopy is wet with intercepted rain (no stomatal limit). Same weather in all cases: 150 W/m² of available energy, 20°C and a VPD of 1 kPa. Aerodynamic conductance from the logarithmic wind profile under neutral conditions. Figure by Daeha Kim, an illustrative calculation, not a result of Wang et al. (2026).
Leaves versus ecosystems
The result seems to contradict an earlier leaf-scale study, in which wind increased leaf WUE because it cooled sunlit leaves and so lowered their transpiration (Schymanski and Or 2016). The authors argue that the two are complementary. Leaf experiments last minutes under strong light, where convective cooling dominates. An ecosystem also loses water from soil and wet canopy surfaces, and over days these non-stomatal losses respond strongly to wind. What holds for a leaf does not automatically scale up to a forest.
Wind trends and the future
Near-surface winds over land weakened over several decades, a trend known as “stilling” (McVicar et al. 2012). For hydrologists, stilling is already familiar from the “pan evaporation paradox”: measured pan evaporation declined in many regions despite rising temperatures. Roderick and Farquhar (2002) traced the decline to dimming sunlight, and later work showed that weakening winds also contributed in many regions (McVicar et al. 2012). The new study adds a biological counterpart: weaker winds have let ecosystems fix carbon with less water.
The authors then used CMIP6 climate models, which reproduce the negative effect of wind on WUE, to estimate how wind trends will affect WUE in the future (Figure 3). In the historical period (1995–2014), declining winds raised WUE. By the end of the century, this wind-driven gain shrinks by about 80% under the low-emission SSP1-2.6, where stilling stops, and disappears under SSP2-4.5, where winds still weaken but WUE is less sensitive to them. Under the high-emission SSP5-8.5, stilling intensifies and the wind-driven gain in WUE stays about as large as in the historical period.
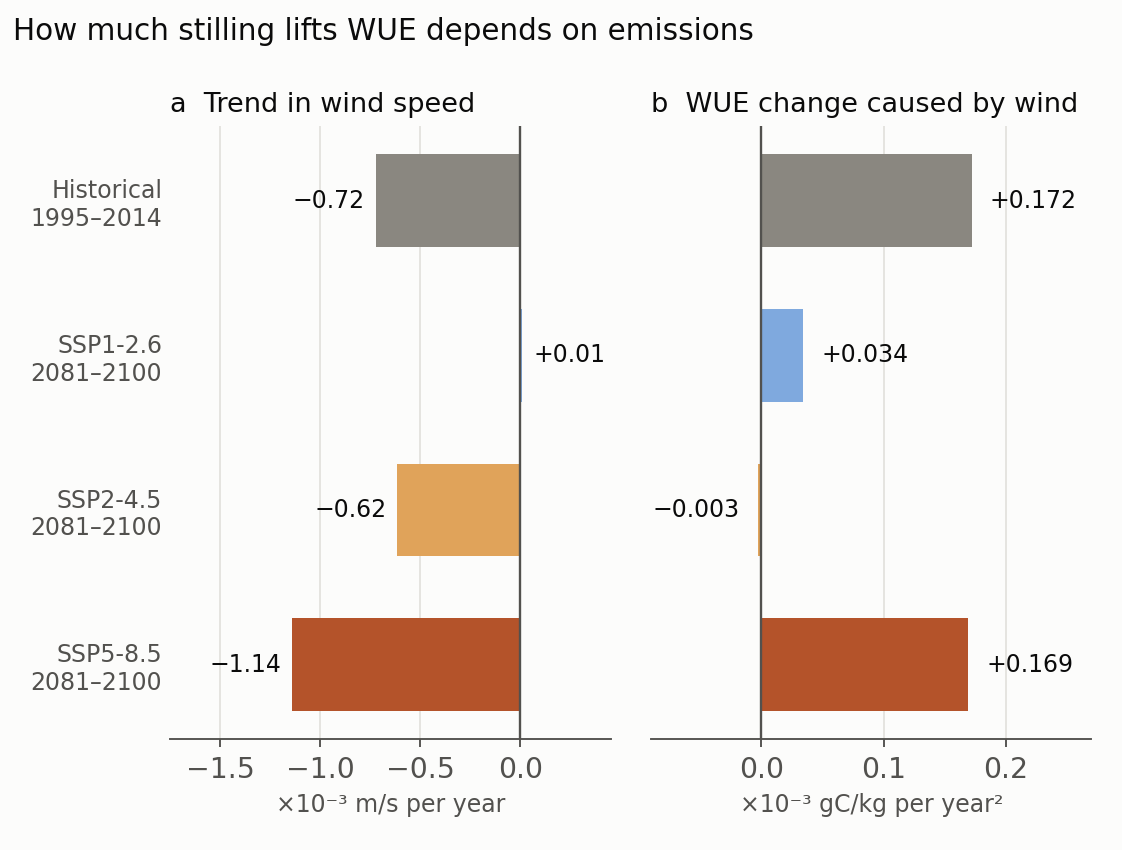
Figure 3. (a) Trends in near-surface wind speed over land in CMIP6 models for 1995–2014 and for 2081–2100 under three emission scenarios. (b) Trend in WUE caused by these wind changes, calculated as the sensitivity of WUE to wind multiplied by the wind trend. Figure by Daeha Kim, drawn from numbers reported in Wang et al. (2026).
There is a feedback, too. Global greening makes the land surface rougher, which slows near-surface wind, which in turn raises WUE. Ecosystems are not only affected by wind; they help shape it.
Caveats
- Daily relationships, not long-term experiments. The analysis uses day-to-day variation. Persistent changes in wind can also alter canopy structure, phenology and mortality, and those slower effects are not captured.
- Wind trends are not smooth. Observations show that global terrestrial stilling reversed around 2010 (Zeng et al. 2019), which reminds us that wind trends can change direction within a decade.
- ET partitioning remains uncertain. Separating transpiration from soil and canopy evaporation at flux towers is difficult, which limits how precisely the mechanism can be pinned down.
- Models treat wind only indirectly. Earth system models represent wind through turbulence and the energy balance but have no explicit wind effects on stomata or photosynthesis.
What a hydrologist takes from it
WUE trends need wind in the attribution. If wind affects WUE as strongly as temperature or sunlight, part of the rise in WUE commonly attributed to CO₂ may reflect stilling. Studies that attribute long-term WUE trends should include wind speed as a driver.
Aerodynamic terms deserve the same attention as stomata. In much of ecohydrology, the canopy conductance gets the attention and the aerodynamic conductance is treated as a technicality. This study shows that at the ecosystem scale, the air side of the Penman–Monteith equation can dominate.
Interception is part of the carbon–water story. The strongest effects appeared where canopies are rough and often wet. Rainfall interception, a classic topic in forest hydrology, turns out to shape how efficiently ecosystems use water.
Bottom line
Across 146 flux towers, windier days lower ecosystem water use efficiency at four out of five sites, mainly because wind speeds up evaporation rather than because plants photosynthesize less. The effect is strongest in conifer forests and humid climates, where rough, often wet canopies lose water quickly to moving air. The long decline of winds over land has quietly raised WUE, and how much this continues depends on emissions. Wind belongs alongside CO₂, temperature and dryness as a driver of the carbon–water balance.
Questions to think about
- If part of the observed rise in WUE comes from stilling rather than CO₂, how would you design an analysis to separate the two?
- Why might the effect of wind on WUE be close to zero in arid climates, where VPD is high?
- Rainfall interception is often ignored in large-scale WUE studies. In a Korean forest catchment, how large would you expect the wet-canopy contribution to growing-season ET to be?
한 줄 요약 (Korean summary). 물 이용 효율(WUE)은 생태계가 물 1 kg을 증발시키며 얻는 탄소의 양으로, 그동안 CO₂, 기온, 일사, 대기 건조도의 영향은 많이 연구되었지만 바람의 역할은 거의 다뤄지지 않았다. Wang 등(2026)은 전 세계 146개 에디 공분산 관측소 자료를 분석해, 다른 기상 요인의 영향을 제거해도 바람이 강한 날 WUE가 낮아지는 지점이 79.5%에 이르고 반대인 지점은 5.5%뿐임을 보였다. 풍속 1 m/s 증가당 WUE는 평균 약 0.26 gC/kg 감소했고, 상록침엽수림과 습윤 기후에서 가장 컸으며 건조 기후에서는 거의 0이었다. 원인은 주로 증발산 증가다. 바람은 기공을 더 열게 하는 것이 아니라 공기역학적 전도도를 높여 수증기를 더 빨리 실어 나르고, 대기를 더 건조하게 만든다. Penman–Monteith 식으로 계산해 보면 건조한 canopy의 증산은 풍속이 1에서 5 m/s로 늘 때 약 20% 늘지만, 차단된 빗물로 젖은 침엽수림 canopy의 증발은 세 배 이상 늘어 거칠고 젖은 canopy에서 바람의 영향이 가장 크다는 것을 알 수 있다. 지난 수십 년 동안 육상 풍속이 줄어든 현상(stilling)은 WUE를 조용히 높여 왔으며, CMIP6 전망에서는 이 효과가 저배출 시나리오에서 크게 줄고 고배출 시나리오에서는 현재 수준으로 유지된다. 따라서 장기 WUE 변화를 CO₂ 효과만으로 해석해서는 안 되며, 바람을 주요 요인으로 함께 고려해야 한다.
References
Wang, X., Peñuelas, J., Ciais, P., Du, C., Smith, W. K., He, P., Feng, H., et al. (2026). High wind speed reduces water use efficiency across terrestrial ecosystems. Nature Climate Change. https://doi.org/10.1038/s41558-026-02781-z
Keenan, T. F., Hollinger, D. Y., Bohrer, G., Dragoni, D., Munger, J. W., Schmid, H. P., & Richardson, A. D. (2013). Increase in forest water-use efficiency as atmospheric carbon dioxide concentrations rise. Nature, 499, 324–327. https://doi.org/10.1038/nature12291
McVicar, T. R., Roderick, M. L., Donohue, R. J., Li, L. T., Van Niel, T. G., Thomas, A., et al. (2012). Global review and synthesis of trends in observed terrestrial near-surface wind speeds: implications for evaporation. Journal of Hydrology, 416–417, 182–205. https://doi.org/10.1016/j.jhydrol.2011.10.024
Roderick, M. L., & Farquhar, G. D. (2002). The cause of decreased pan evaporation over the past 50 years. Science, 298, 1410–1411. https://doi.org/10.1126/science.1075390-a
Schymanski, S. J., & Or, D. (2016). Wind increases leaf water use efficiency. Plant, Cell & Environment, 39, 1448–1459. https://doi.org/10.1111/pce.12700
Zeng, Z., Ziegler, A. D., Searchinger, T., Yang, L., Chen, A., Ju, K., et al. (2019). A reversal in global terrestrial stilling and its implications for wind energy production. Nature Climate Change, 9, 979–985. https://doi.org/10.1038/s41558-019-0622-6
All three figures are original. The Python scripts that produce them are available on GitHub: Figure 1, Figure 2, Figure 3.