Where our CO₂ goes, and how much is left to emit
Every hydrology student learns the water balance before anything else: precipitation equals evapotranspiration plus runoff plus the change in storage, and whatever does not close is the error term. The global carbon cycle can be read in exactly the same way. Each year the Global Carbon Project closes this balance for carbon dioxide, and its latest edition, the Global Carbon Budget 2025, was published this year (Friedlingstein et al. 2026b). A companion paper in Nature explains why several terms of the budget were revised (Friedlingstein et al. 2026a), and a short review by Deng and colleagues breaks down where fossil CO₂ comes from, sector by sector (Deng et al. 2025).
In this post I read the three papers together and try to answer four questions. Where does the CO₂ we emit go? What changed in our understanding? What does “the remaining carbon budget” actually mean? And which sectors would have to change, and by how much?
The carbon budget is a mass balance
The budget has five main terms. On the source side are emissions from fossil fuels and cement (EFOS) and net emissions from land-use change, mostly deforestation (ELUC). On the receiving side are the growth of CO₂ in the atmosphere (GATM), uptake by the ocean (SOCEAN) and uptake by land ecosystems (SLAND). What is left over is the budget imbalance:
BIM = EFOS + ELUC − (GATM + SOCEAN + SLAND)
Hydrologists will recognize the structure. Two terms are measured well: fossil emissions come from energy statistics, and the atmospheric growth comes from direct CO₂ measurements. The other three are estimated with models and indirect data, in the same way that we often estimate evapotranspiration or groundwater storage. The imbalance is a check on the whole system.
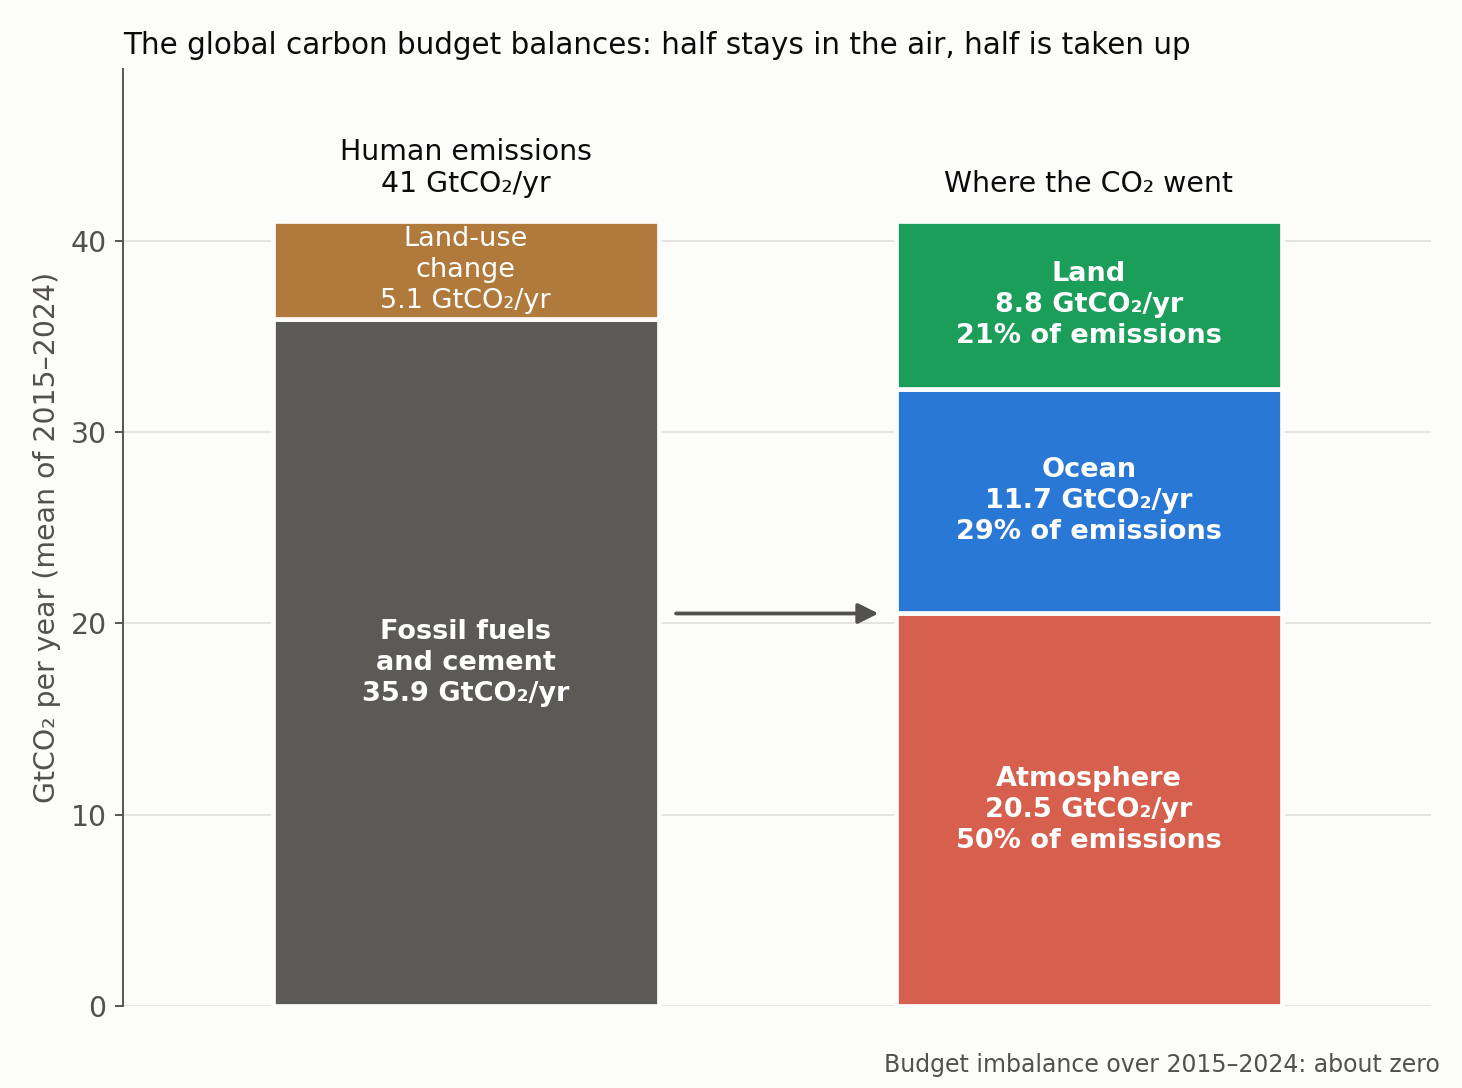
Figure 1. The global carbon budget averaged over 2015–2024. Human emissions of about 41 GtCO₂ per year (left) are balanced by the growth of CO₂ in the atmosphere and by uptake in the ocean and on land (right). Figure by Daeha Kim, drawn from the decadal budget in Friedlingstein et al. (2026b), converted from carbon to CO₂ (1 GtC = 3.664 GtCO₂).
Over the last decade, humans emitted about 41 GtCO₂ per year, 88% of it from fossil fuels and 12% from land-use change. Half of it stayed in the atmosphere. The ocean took up 29% and land ecosystems 21%. In 2024 alone, total emissions reached 42.4 GtCO₂, and the CO₂ concentration averaged 422.8 ppm. The preliminary estimate for 2025 is 425.6 ppm, 53% above the pre-industrial level of about 278 ppm.
The long view is just as instructive. Since 1850, humans have emitted about 2,700 GtCO₂ (745 GtC). Of this, 39% is still in the atmosphere, 27% has gone into the ocean and 24% into land ecosystems. Land-use change emitted more over this period than the land sink took up, so the land as a whole has been a net source.
What changed: a weaker land, a stronger ocean
For years, the budget did not quite close. The 2024 edition had an imbalance of −0.4 GtC per year over the last decade, meaning that either the sources were too small or the sinks too large, and this imbalance had a trend. A budget with a trending error term is hard to interpret, just as a water balance with a drifting residual makes it hard to say whether evapotranspiration is really changing.
The Nature paper fixes this by adding processes that were known but missing (Friedlingstein et al. 2026a). Three corrections stand out.
- Land-use emissions were too low. The models assumed that a hectare of forest always stores the same amount of carbon. In reality, forests store more today than in the past because of higher CO₂, so clearing one releases more. Accounting for this raises land-use emissions slightly.
- The land sink was too large. The models computed the land sink on a pre-industrial land-cover map, ignoring that about a fifth of the world’s forest area has since been lost. Forests are among the strongest sinks, so this inflated the sink. Correcting it reduces the land sink by about 0.5 GtC per year.
- The ocean sink was too small. Ocean models are known to underestimate uptake by about 10%, and observation-based estimates missed the effect of the thin, cool skin at the sea surface. Correcting both raises the ocean sink.
One more correction is close to home for hydrologists. Human activities have increased the amount of carbon that moves from soils into rivers, lakes and reservoirs. The paper estimates that this lateral flux is now 0.54 GtC per year higher than before industrialization. Most of it is CO₂ from soil respiration that simply escapes through the water instead of the soil surface, so it does not change the land sink. But part of it is organic carbon that is lost from land ecosystems and released by inland waters, and that part does reduce the land sink. The correction is small, about 0.07 GtC per year, but it is a reminder that inland waters are not just pipes; they are an active part of the carbon cycle.
After these corrections, the net land sink over 2014–2023 drops by 31%, from 2.1 to 1.4 GtC per year, and the ocean now takes up about 15% more carbon than the land does. The imbalance falls to nearly zero and its trend is no longer significant. Just as important, the revised numbers agree with two independent checks, atmospheric inversions and atmospheric oxygen measurements, which gives more confidence that the budget is now right for the right reasons.
Climate change is weakening the sinks
With a budget that closes, the authors could ask a sharper question: how much has climate change itself reduced the sinks? Using model runs with rising CO₂ but a constant climate, they estimate that warming and changing rainfall reduced the land sink by about 23% and the ocean sink by about 6% over the last decade. Since 1960 this has left about 30 GtC more in the atmosphere, or 8.3 ppm, which is roughly 8% of the observed CO₂ rise.
The effect is largest in the tropics. The combined pressure of climate change and deforestation has turned the tropical forests of Southeast Asia and large parts of South America from sinks into sources. In South America, the main cause is now climate stress on the forest rather than clearing.
The year 2024 showed what this looks like in a single year. During the 2023–2024 El Niño, the land sink dropped to 1.9 GtC, and the atmospheric CO₂ growth rate hit a record 3.7 ppm. For those of us who study droughts and evapotranspiration, this is the part of the carbon budget that is really a water story: when land ecosystems run short of water, they stop absorbing carbon.
What the remaining carbon budget means
Warming depends, to a good approximation, on cumulative CO₂ emissions, not on the emission rate in any one year. The Global Carbon Budget 2025 puts it simply: every additional 180 GtCO₂ adds about 0.1°C of warming. That is why we can speak of a carbon budget at all. It works less like a speed limit and more like a reservoir: what matters is the total volume released, and once it is released it stays released.
From January 2026, the remaining budgets for a 50% chance of staying below each warming level are:
- 1.5°C: about 170 GtCO₂, roughly 4 years at the 2025 emission rate;
- 1.7°C: about 525 GtCO₂, roughly 12 years;
- 2.0°C: about 1,055 GtCO₂, roughly 25 years.
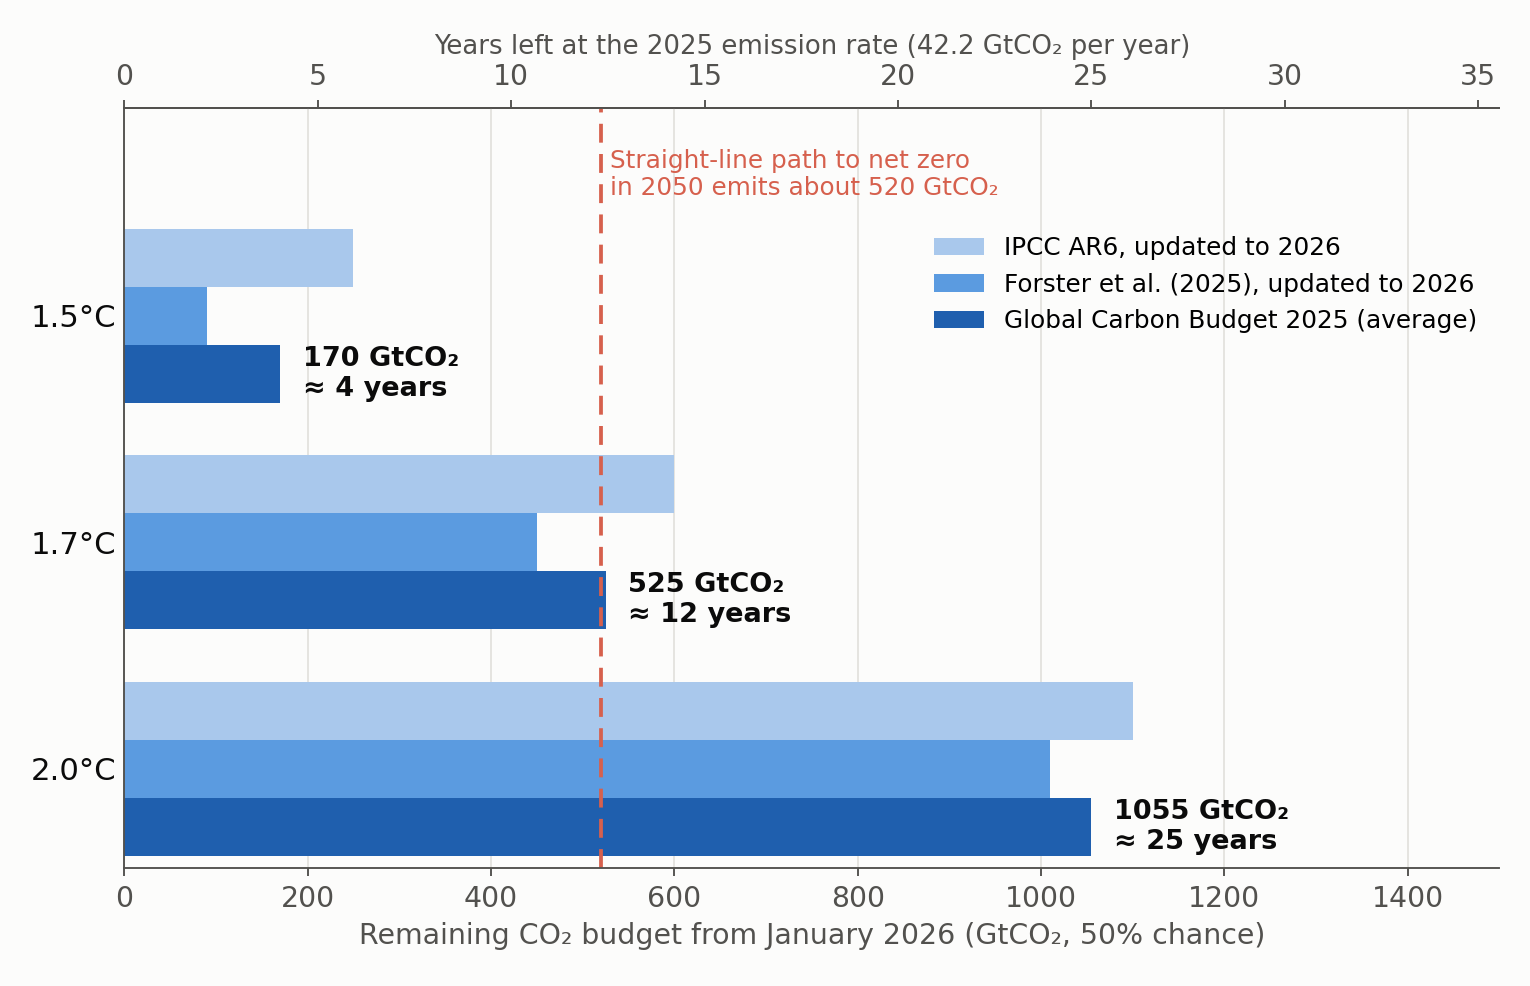
Figure 2. Remaining CO₂ budgets from January 2026 for a 50% chance of limiting warming to 1.5, 1.7 and 2.0°C. The two lighter bars are two published estimates, each updated to 2026; the dark bar is their average, used in the Global Carbon Budget 2025. The top axis converts the budgets into years at the 2025 emission rate. The dashed line marks the cumulative emissions of a straight-line path from today to net zero in 2050. Figure by Daeha Kim, drawn from numbers reported in Friedlingstein et al. (2026b).
Three things are worth noting. First, the estimates differ a lot, especially for 1.5°C (90 versus 250 GtCO₂), mainly because of how the warming from other gases such as methane is modelled. In an earlier post on overshoot I used a UNEP figure of 130 GtCO₂; it sits inside this range. Deng et al. (2025), using different starting points, go as far as to say that the 1.5°C budget may already be used up.
Second, at today’s emission rate, warming increases by about 0.023°C every year, or about a quarter of a degree per decade. The budget does not tell us when 1.5°C will be crossed in a given year, but it does tell us how fast the long-term level is rising.
Third, even a demanding plan does not fit inside the 1.5°C budget. Reaching net zero CO₂ by 2050 in a straight line would mean cutting emissions by about 1.7 GtCO₂, or 4%, every year. That is similar to the drop in 2020 during the COVID-19 lockdowns, repeated every year for 25 years. Even so, it would add about 520 GtCO₂ along the way: three times the 1.5°C budget, but just within the budget for 1.7°C. Warming stops only when net CO₂ emissions reach zero; cutting them slows warming but does not stop it.
Who emits what
Deng et al. (2025) use near-real-time activity data from the Carbon Monitor project to break down fossil CO₂ emissions by sector. Their total for 2024 is 36.3 GtCO₂, a little lower than the Global Carbon Project’s 37.8 GtCO₂, because the two datasets are built differently.
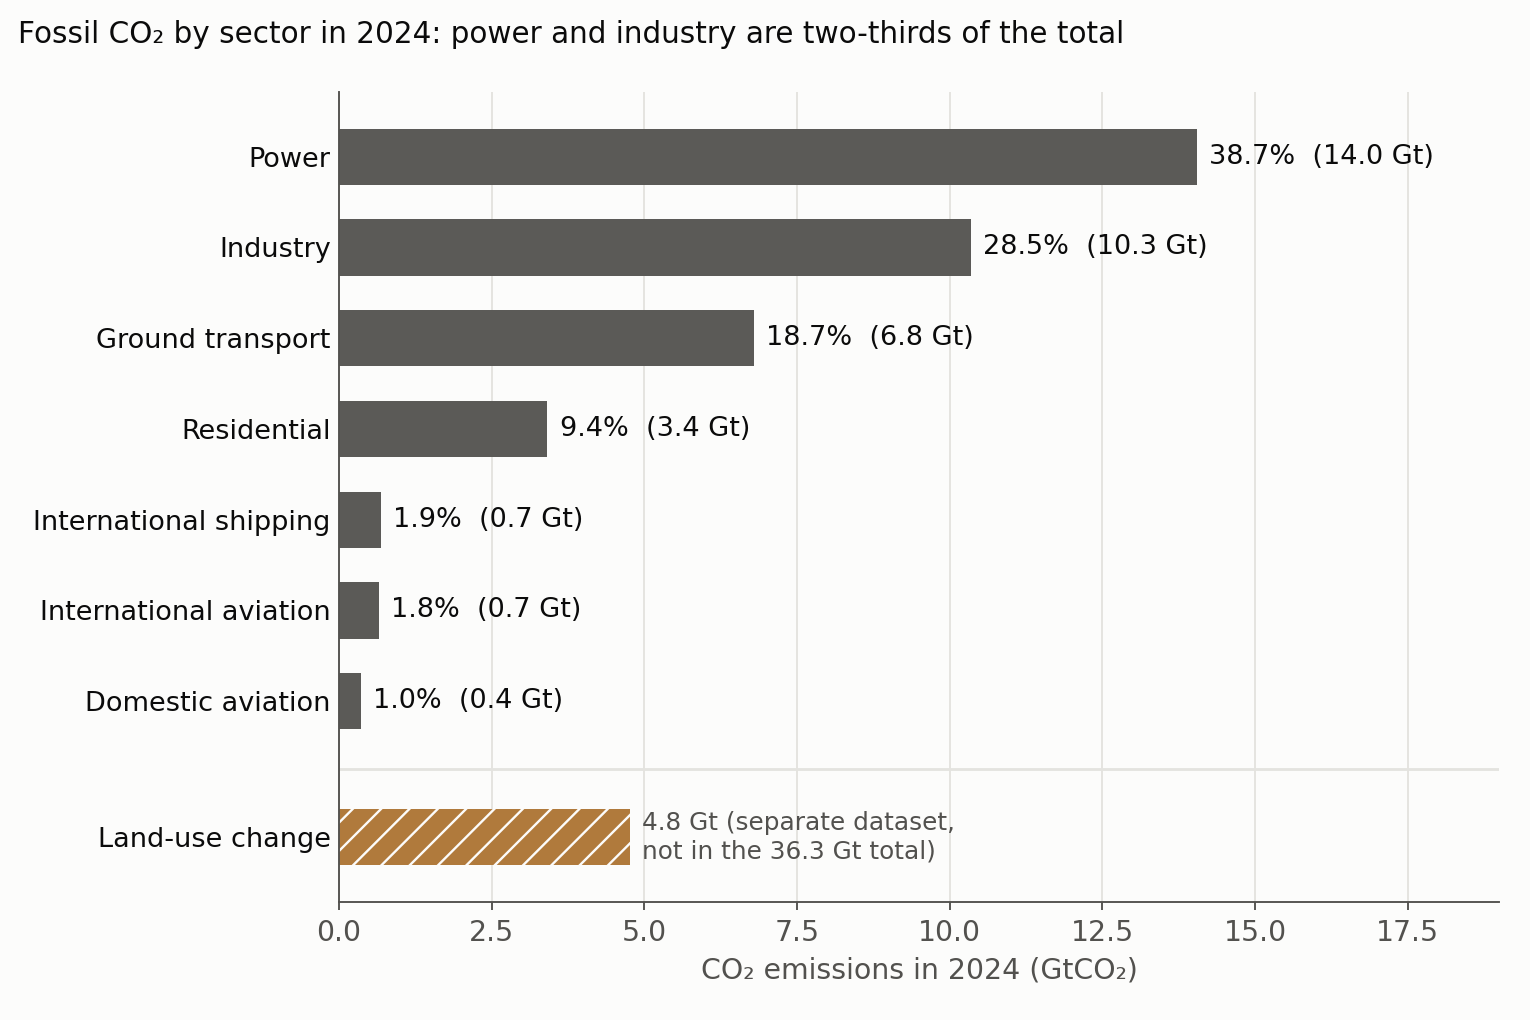
Figure 3. Fossil CO₂ emissions by sector in 2024 from the Carbon Monitor project, as shares of the 36.3 GtCO₂ total. Land-use change emissions in 2024 from the Global Carbon Budget 2025 are shown separately for comparison; they come from a different dataset and are not part of the 36.3 GtCO₂. Figure by Daeha Kim, drawn from numbers reported in Deng et al. (2025) and Friedlingstein et al. (2026b).
Power generation is the largest single source at 38.7%, followed by industry at 28.5%, ground transport at 18.7% and residential use at 9.4%. Aviation and shipping together are under 5%, but international aviation grew fastest in 2024, by almost 10%. By fuel, the Global Carbon Project attributes 41% of fossil CO₂ to coal, 32% to oil, 21% to natural gas and 4% to cement. Land-use change adds roughly another 4.8 GtCO₂.
How much could each sector cut?
This is where I want to be careful. None of the three papers estimates how far each sector could cut its emissions. What they do provide are pieces of evidence about where cuts are already happening and where they are not.
- Power is where the tools already work. Deng et al. estimate that hydro, nuclear, wind and solar electricity avoided 9.8 GtCO₂ in 2024 compared with generating the same electricity from fossil fuels, with solar output up 25% in one year. Using projections from the International Energy Agency, they estimate a further 682 GtCO₂ could be avoided between 2025 and 2050, mostly by wind and solar.
- Stopping deforestation is the largest single lever on land. Gross emissions from deforestation are about 1.9 GtC (about 7 GtCO₂) per year, of which regrowth and afforestation offset about two thirds. Brazil, Indonesia and the Democratic Republic of the Congo account for more than half of net land-use emissions.
- Growth without more CO₂ is possible. Between 2015 and 2024, 35 countries cut their fossil CO₂ emissions while their economies grew, nearly twice as many as in the previous decade. Together they produce 27% of global fossil emissions.
- Industry and aviation are the hard part. Deng et al. point to heavy industry and aviation as sectors whose emissions are still rising; they are widely regarded as the hardest to decarbonize.
For sector-by-sector potentials, the standard reference is the IPCC’s mitigation report, which concluded that options costing 100 US dollars per tonne of CO₂-equivalent or less could reduce global greenhouse gas emissions by at least half of the 2019 level by 2030 (IPCC 2022). That is a statement about what is technically and economically available, not about what is happening.
What a hydrologist takes from it
Closing the budget matters. The improvement in this year’s carbon budget came not from new satellites but from adding known processes and checking the result against independent data. It is the same discipline we try to teach in catchment hydrology: if the balance does not close, something is missing, and the residual is telling you what.
The land sink is a water problem. The weakening of the land sink is concentrated in the tropics and shows up in drought years. Better estimates of evapotranspiration and soil moisture are not only a matter of water supply; they are part of predicting how much CO₂ stays in the air.
Inland waters belong in the carbon cycle. Rivers, lakes and reservoirs emit, bury and transport carbon, and human activity has changed all three. That is a research frontier where hydrologists have something to offer.
Bottom line
- Humans emit about 41 GtCO₂ per year. Half stays in the atmosphere; the ocean takes up 29% and land 21%.
- After corrections, the land sink is weaker and the ocean sink stronger than previously thought, and the budget now closes.
- Climate change has already reduced the land sink by about a quarter and the ocean sink by about 6%, adding about 8 ppm to atmospheric CO₂ since 1960.
- At current emissions, the 1.5°C budget lasts about 4 more years, the 1.7°C budget about 12 and the 2°C budget about 25.
- Power and industry emit about two thirds of fossil CO₂. Power has proven alternatives; industry and aviation do not yet.
Questions to think about
- The carbon budget and the catchment water balance both have an imbalance term. In your own catchment, which water balance term would you suspect first if the balance did not close, and why?
- The land sink dropped sharply in the 2023–2024 El Niño. What hydrological variables would you monitor to anticipate such a drop?
- If every 180 GtCO₂ adds 0.1°C, how much additional warming is implied by a straight-line path to net zero in 2050?
한 줄 요약 (Korean summary). 지구 탄소 순환은 물수지처럼 하나의 질량수지로 읽을 수 있다. 『Global Carbon Budget 2025』에 따르면 최근 10년(2015–2024) 동안 인류는 해마다 약 41 GtCO₂를 배출했고(화석연료 88%, 토지이용 변화 12%), 그중 절반은 대기에 남고 29%는 해양이, 21%는 육상 생태계가 흡수했다. 함께 발표된 『Nature』 논문은 그동안 빠져 있던 과정(현재 산림의 더 높은 탄소 밀도, 줄어든 산림 면적, 하천·호수로의 탄소 유출, 해수면 냉피층 효과)을 반영해 육상 흡수원은 이전 추정보다 약하고 해양 흡수원은 더 강하다는 것을 보였고, 그 결과 수지가 거의 맞게 되었다. 기후변화가 없었을 경우와 비교하면, 최근 10년 동안 육상 생태계는 약 23%, 해양은 약 6% 적게 CO₂를 흡수했다. 1960년 이후 이렇게 덜 흡수된 CO₂가 쌓여 대기 CO₂ 농도를 약 8 ppm 더 높였다. 2026년 초부터 남은 탄소예산(50% 확률)은 1.5°C 기준 약 170 GtCO₂로 현재 배출 속도로 약 4년, 1.7°C는 약 12년, 2°C는 약 25년 분량이다. 화석 CO₂ 배출의 부문별 비중(2024)은 발전 38.7%, 산업 28.5%, 도로 수송 18.7%, 가정 9.4% 순이다. 발전 부문은 재생에너지라는 검증된 대안이 있고 산림 파괴를 멈추는 것도 큰 감축 수단이지만, 산업과 항공은 아직 어렵다. 세 논문은 부문별 감축 가능량을 직접 추정하지 않으며, 이는 IPCC 보고서의 몫이다.
References
Friedlingstein, P., Le Quéré, C., O’Sullivan, M., Hauck, J., Landschützer, P., Luijkx, I. T., et al. (2026a). Emerging climate impact on carbon sinks in a consolidated carbon budget. Nature, 649, 98–103. https://doi.org/10.1038/s41586-025-09802-5
Friedlingstein, P., O’Sullivan, M., Jones, M. W., Andrew, R. M., Bakker, D. C. E., Hauck, J., et al. (2026b). Global Carbon Budget 2025. Earth System Science Data, 18, 3211–3288. https://doi.org/10.5194/essd-18-3211-2026
Deng, Z., Zhu, B., Davis, S. J., Ciais, P., Guan, D., Gong, P., & Liu, Z. (2025). Global carbon emissions and decarbonization in 2024. Nature Reviews Earth & Environment, 6, 231–233. https://doi.org/10.1038/s43017-025-00658-x
IPCC (2022). Summary for Policymakers. In Climate Change 2022: Mitigation of Climate Change. Contribution of Working Group III to the Sixth Assessment Report of the Intergovernmental Panel on Climate Change (pp. 3–48). Cambridge University Press. https://doi.org/10.1017/9781009157926.001
All three figures are original. The Python scripts that produce them are available on GitHub: Figure 1, Figure 2 and Figure 3.