Seawater intrusion in a warming world: what 480,000 coastal wells tell us
About 2.86 billion people live in coastal regions, and many of them drink, irrigate and run industries on groundwater. Beneath every coast, that fresh groundwater sits on top of denser seawater, held back only by the pressure of the freshwater flowing toward the sea. When that pressure weakens, seawater moves inland and wells turn salty. Once an aquifer is salinized, it can take decades to recover.
Sea-level rise is the obvious climate threat to coastal groundwater, but it is not the only one, and so far it may not be the largest. A new study in Nature Water by Annika Nolte and colleagues assembles groundwater-level records from about 480,000 coastal monitoring locations worldwide to map where coastal aquifers are already susceptible to seawater intrusion and how that is changing (Nolte et al. 2026). This post summarizes what they found and what it means for a warming world.
The physics in one number
The key quantity is the hydraulic gradient between the land and the sea: how much higher the groundwater stands inland than sea level, per unit distance. A clearly seaward gradient pushes fresh water out to sea and holds the seawater back. A flat or landward gradient leaves little resistance, and seawater can advance.
The authors use a threshold from earlier modeling studies: a gradient of 10⁻³ (1 m of head per kilometer) or less counts as “flat” and favors intrusion. They combine it with aridity, expressed as the ratio of precipitation to potential evapotranspiration, which tells us whether recharge is limited by water (dry, aridity index ≤ 1) or by energy (wet, aridity index > 1). This gives four clusters, from the most susceptible (flat gradient on a dry coast, C1) to the least (steep gradient on a wet coast, C4).
The reason small changes in head matter so much is a century-old rule of thumb, the Ghyben–Herzberg relation. Because seawater is only about 2.5% denser than fresh water, the boundary between them lies roughly 40 times deeper below sea level than the freshwater table stands above it (Werner et al. 2013). Lose 1 m of freshwater head, and the freshwater lens beneath can lose about 40 m of thickness.
What they found
Flat gradients are common. About one-third of all observed coastal areas have flat gradients, and they remain common even tens of kilometers inland (34–37% of observations). The most susceptible combination, flat gradients on dry coasts, accounts for 28% of observations within 1 km of the coastline and forms continuous belts along the southeastern United States, the Gulf of Mexico and northeastern Australia. Coastal water tables are shallow: the median depth is 6.1 m, and nearly half are shallower than 5 m.
Groundwater levels are moving. Over 1990–2024, 21% of gridded coastal areas show statistically detectable trends of at least 0.1 m per year over 19-year windows, and 28% over 9-year windows. Declines have become more frequent recently: in the 9-year windows, 58% of trends are downward. Combining both windows, 24% of locations show significant trends, 54% of them downward. Rural areas show slightly more trends than urban areas (26% versus 22%), a reminder that much pumping happens outside cities, much of it for agriculture.
Dry coasts change fastest. On water-limited coasts, 34–36% of locations show significant trends; on wet coasts, only 3–12% do (Figure 1a). At 100 km from the coast, the size of the trend correlates with aridity (Spearman ρ = 0.56) and with water-table depth (ρ = 0.63). Deep water tables in dry, rural regions show the most widespread declines.
Susceptibility tends to persist. Extrapolating each location’s recent trend over the next decade, 93.4% of the susceptible locations stay susceptible, 3.5% newly become susceptible, and 3.1% recover a clearly seaward gradient (Figure 1b).
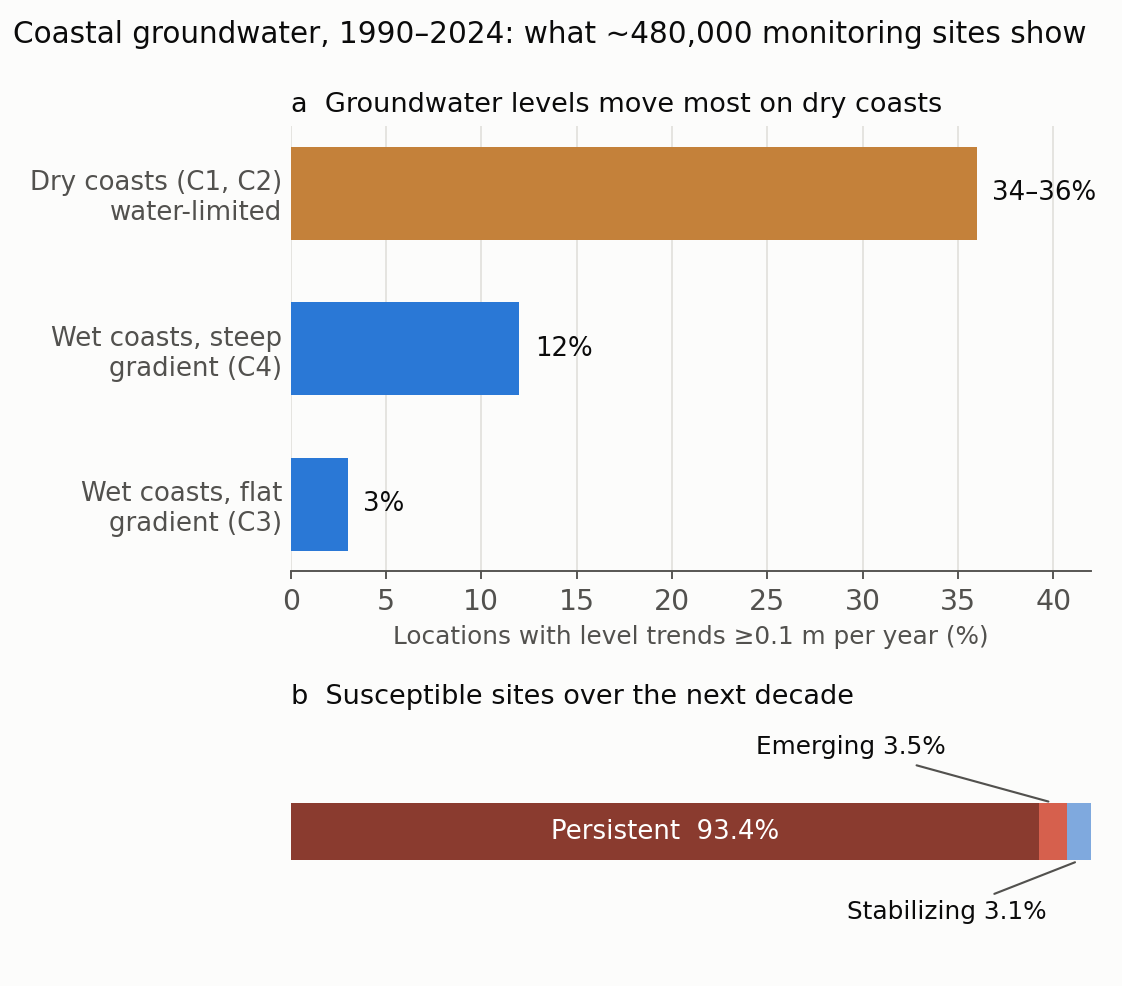
Figure 1. (a) Share of coastal locations with significant groundwater-level trends (at least 0.1 m per year) on dry (water-limited) and wet (energy-limited) coasts. (b) Of the locations that are or will become susceptible to seawater intrusion over the next decade, the share that persist, newly emerge or stabilize if recent trends continue. Figure by Daeha Kim, drawn from numbers reported in Nolte et al. (2026).
What it means for a warming world
The paper is an observational screening, not a climate projection. But its findings bear directly on how global warming will affect coastal groundwater, through three channels.
1. Sea-level rise lifts the boundary. Global mean sea level is now rising at about 4.5 mm per year, a rate that has doubled over the past three decades (Hamlington et al. 2024), and it is projected to rise by roughly 0.3–1.0 m by 2100 relative to 1995–2014, depending on emissions. Higher seas raise the head at the coastline. Where inland groundwater can rise along with the sea, the gradient is preserved. But on low-lying coastal plains, the water table is already close to the land surface and has little room to rise; there, sea-level rise flattens the gradient directly (Michael et al. 2013). The paper’s finding that flat gradients are already common means that many coasts start with little margin.
Figure 2 shows what this means in a simple case: a coast with exactly the paper’s “flat” gradient of 10⁻³, where the water table cannot rise. A 1 m rise in sea level removes the freshwater lens entirely within 1 km of the coast and thins it by 40 m everywhere inland.
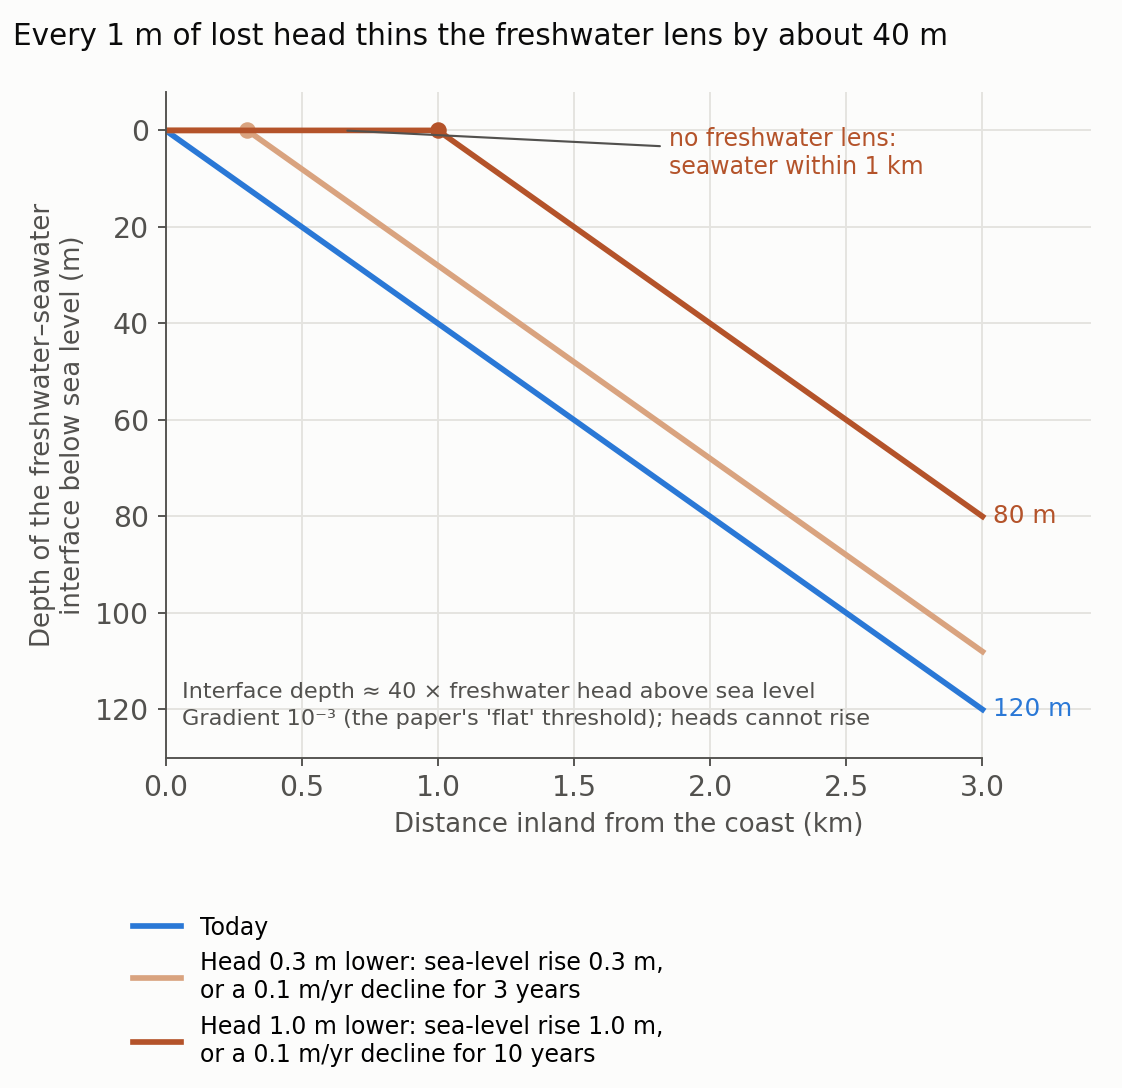
Figure 2. Depth of the freshwater–seawater interface along a coast with a land–sea gradient of 10⁻³, using the Ghyben–Herzberg approximation (interface depth ≈ 40 × freshwater head above sea level), for today and after the head above sea level drops by 0.3 m or 1.0 m. The drop can come from sea-level rise where inland heads cannot rise, or from a groundwater decline of 0.1 m per year sustained for 3 or 10 years. Steady state, homogeneous aquifer, sharp interface. Figure by Daeha Kim, an illustrative calculation, not a result of Nolte et al. (2026).
2. For now, falling groundwater outpaces rising seas. The same figure makes a second point. The paper counts a trend as significant when groundwater changes by at least 0.1 m per year, more than 20 times the current rate of sea-level rise. A decade of decline at that threshold removes as much head as the upper end of projected sea-level rise for the entire century. Over the coming decades, how much groundwater we pump and how much recharge reaches the aquifer will matter more for seawater intrusion in many places than sea level itself. This agrees with an earlier global analysis that found coastal aquifers more vulnerable to groundwater extraction than to projected sea-level rise (Ferguson and Gleeson 2012). Sea-level rise, however, will not stop in 2100, and it cannot be reversed by management.
3. A drier climate weakens the freshwater side. Warming raises evaporative demand, and in many regions it shifts rainfall patterns, both of which can reduce groundwater recharge. The paper finds that 74% of its observations lie on water-limited coasts and that many cluster near an aridity index of 1, the boundary between dry and wet climates. Recharge is especially sensitive to changes in long-term aridity in exactly this zone (Berghuijs et al. 2024). The paper’s strongest signal, that groundwater changes fastest on dry coasts, therefore points to where a warming climate is likely to bite first: as climates dry, more coasts move into the water-limited clusters, where recharge cannot restore the freshwater head. In some regions with low gradient-based susceptibility, such as parts of South Africa, the authors find substantial groundwater declines together with projected recharge reductions under 3°C of global warming, a combination relevant to “day zero” water crises.
Delays, data gaps and room for hope
Three further points from the paper shape how we should respond.
Aquifers respond slowly. Deep groundwater systems have long memories. The declines seen in deep, dry, rural aquifers may continue for years after pumping is reduced, and management may take years to decades to show measurable recovery. Expectations and monitoring plans have to account for that delay.
The map has holes. Coverage is strongest in Europe and the United States. Most of Africa, equatorial regions, large parts of South America and Asia, and many small islands are sparsely represented or missing, and several documented intrusion sites lie outside the dataset. The authors stress that the absence of a hotspot in a data-poor region should not be read as the absence of risk. Many of the places most exposed to sea-level rise are precisely where data are thinnest.
Recovery is possible. Rising groundwater levels are about as common as falling ones, globally and in many regions. Coastal aquifers are not uniformly moving toward greater susceptibility, and the 3.1% of locations that are stabilizing show that the trend can be turned. A global synthesis of aquifer trends likewise found that declines can slow or reverse where policy changes reduced pumping or added recharge (Jasechko et al. 2024).
What a hydrologist takes from it
Monitor heads near the coast, and measure salinity alongside them. The hydraulic gradient is cheap to compute from water levels that agencies already collect. The authors call for co-located salinity monitoring to turn susceptibility into actual vulnerability, and for data synthesis across countries.
Manage the freshwater side, because it is the side we control. We cannot stop sea-level rise within decades, but we can control pumping, recharge and land drainage. On susceptible coasts, managed aquifer recharge and limits on abstraction directly buy back head.
Do not rely on coastal groundwater as an unlimited drought reserve. Groundwater is often the fallback when surface water fails. On coasts that are already susceptible or declining, that reserve may be smaller and saltier than we assume, exactly when droughts in a warmer climate make it most needed.
Bottom line
Nolte and colleagues offer the first global, observation-based picture of where coastal groundwater is susceptible to seawater intrusion. Flat land–sea gradients are common, groundwater levels are moving at about a fifth of coastal locations, declines have become more frequent, and dry coasts change fastest. For a warming world, this means two pressures on the same balance: rising seas push from one side, while a drier climate and heavy pumping weaken the other. In the near term, the freshwater side, which we can manage, matters most; in the long term, sea-level rise will keep pushing. Monitoring, especially where data are scarce, is the first step.
Questions to think about
- On a low-lying coastal plain where the water table is already near the surface, what happens to the extra recharge that cannot raise the water table, and how does that affect flooding and drainage?
- The paper uses a 10⁻³ gradient threshold for all coasts. How might aquifer type (sand, karst, volcanic rock) change what counts as a safe gradient?
- Korea has long coastlines with reclaimed land and volcanic islands. Which monitoring data would you combine to screen Korean coastal aquifers with this framework?
한 줄 요약 (Korean summary). Nolte 등(2026, 『Nature Water』)은 전 세계 약 48만 개 해안 지하수 관측 지점의 수위 기록으로 해수침투 취약성을 처음으로 지구 규모에서 평가했다. 해안 지역의 약 1/3은 육지에서 바다로 향하는 수리경사가 평탄해(10⁻³ 이하) 해수침투에 취약하고, 1990–2024년 동안 해안 지역의 21%(9년 기준 28%)에서 연 0.1 m 이상의 뚜렷한 지하수위 변화가 나타났으며, 최근에는 하강이 더 잦아졌다. 건조한 해안에서는 지점의 34–36%에서 수위 추세가 나타났지만 습윤한 해안에서는 3–12%에 그쳤고, 현재 추세가 이어지면 취약 지점의 93.4%가 앞으로 10년 동안 취약한 상태로 남는다. 지구온난화 관점에서 보면 해수침투는 두 방향에서 압력을 받는다. 해수면 상승(현재 연 약 4.5 mm, 2100년까지 0.3–1.0 m)은 바다 쪽 수두를 높이고, 기온 상승에 따른 증발 수요 증가와 강수 변화는 함양을 줄여 담수 쪽 수두를 낮춘다. 담수와 해수의 경계는 담수 수두의 약 40배 깊이에 있으므로 수두를 1 m 잃으면 담수렌즈가 약 40 m 얇아진다. 연 0.1 m의 지하수위 하강이 10년 이어지면 금세기 말 해수면 상승 상한과 같은 수두 손실이 생기므로, 앞으로 수십 년 동안은 해수면보다 지하수 양수와 함양 관리가 더 중요하다. 다만 지하수계는 반응이 느리고, 아프리카·아시아·소도서처럼 관측이 부족한 곳에서 취약 지점이 보이지 않는다고 위험이 없다는 뜻은 아니다.
References
Nolte, A., Bender, S., Hartmann, J., Baltruschat, S., Moosdorf, N., & Reinecke, R. (2026). Coastal groundwater-level trends reveal global susceptibility to seawater intrusion. Nature Water, 4, 673–682. https://doi.org/10.1038/s44221-026-00619-8
Berghuijs, W. R., Collenteur, R. A., Jasechko, S., Jaramillo, F., Luijendijk, E., Moeck, C., van der Velde, Y., & Allen, S. T. (2024). Groundwater recharge is sensitive to changing long-term aridity. Nature Climate Change, 14, 357–363. https://doi.org/10.1038/s41558-024-01953-z
Ferguson, G., & Gleeson, T. (2012). Vulnerability of coastal aquifers to groundwater use and climate change. Nature Climate Change, 2, 342–345. https://doi.org/10.1038/nclimate1413
Hamlington, B. D., Bellas-Manley, A., Willis, J. K., Fournier, S., Vinogradova, N., Nerem, R. S., Piecuch, C. G., Thompson, P. R., & Kopp, R. (2024). The rate of global sea level rise doubled during the past three decades. Communications Earth & Environment, 5, 601. https://doi.org/10.1038/s43247-024-01761-5
Jasechko, S., Seybold, H., Perrone, D., Fan, Y., Shamsudduha, M., Taylor, R. G., Fallatah, O., & Kirchner, J. W. (2024). Rapid groundwater decline and some cases of recovery in aquifers globally. Nature, 625, 715–721. https://doi.org/10.1038/s41586-023-06879-8
Michael, H. A., Russoniello, C. J., & Byron, L. A. (2013). Global assessment of vulnerability to sea-level rise in topography-limited and recharge-limited coastal groundwater systems. Water Resources Research, 49, 2228–2240. https://doi.org/10.1002/wrcr.20213
Werner, A. D., Bakker, M., Post, V. E. A., Vandenbohede, A., Lu, C., Ataie-Ashtiani, B., Simmons, C. T., & Barry, D. A. (2013). Seawater intrusion processes, investigation and management: recent advances and future challenges. Advances in Water Resources, 51, 3–26. https://doi.org/10.1016/j.advwatres.2012.03.004
Both figures are original. The Python scripts that produce them are available on GitHub: Figure 1, Figure 2.