Farm lime turns out to be a carbon sink
Every year, American farmers spread tens of millions of tonnes of crushed limestone on their fields. The reason is simple: farming makes soils acidic, and acidic soils grow poorer crops. Climate accounting has long treated this practice as a small but certain source of carbon dioxide, since limestone is calcium carbonate and dissolving it can release CO₂.
A study published in Nature in September turns this assumption around (Suhrhoff et al. 2026). Using a century of records from the Mississippi River Basin, Tim Jesper Suhrhoff, Noah Planavsky and colleagues show that liming has, on balance, taken CO₂ out of the atmosphere. In an accompanying commentary, Philip Robertson and Stephen Hamilton, who reported early evidence of the same effect in Michigan almost twenty years ago (Hamilton et al. 2007), call it an unexpected carbon sink (Robertson and Hamilton 2026). The argument is a lesson in choosing the right baseline, and the decisive evidence comes from river water.
Why farmers lime
Soils become more acidic under intensive farming for several reasons. Nitrogen fertilizer and manure are converted by soil microbes into nitric acid. Burning fossil fuels has added sulfuric and nitric acid through acid rain. Decomposing soil organic matter adds more. In the cornfields of the US Midwest, natural processes cannot keep up, so farmers add lime (ground limestone or dolomite) to bring the soil pH back to where crops do best.
Two ways lime can dissolve
What happens to the carbon in lime depends on which acid dissolves it (Figure 1). When lime meets a strong acid such as nitric or sulfuric acid, its carbon is released as CO₂. When it meets carbonic acid, which forms when CO₂ from roots and microbes dissolves in soil water, the reaction goes the other way: it takes up CO₂ and stores it as bicarbonate. Bicarbonate drains into groundwater and rivers, reaches the ocean, and stays there for thousands of years. Soils are patchy, so both reactions happen side by side, and the balance between them decides whether lime is a net source or a net sink.
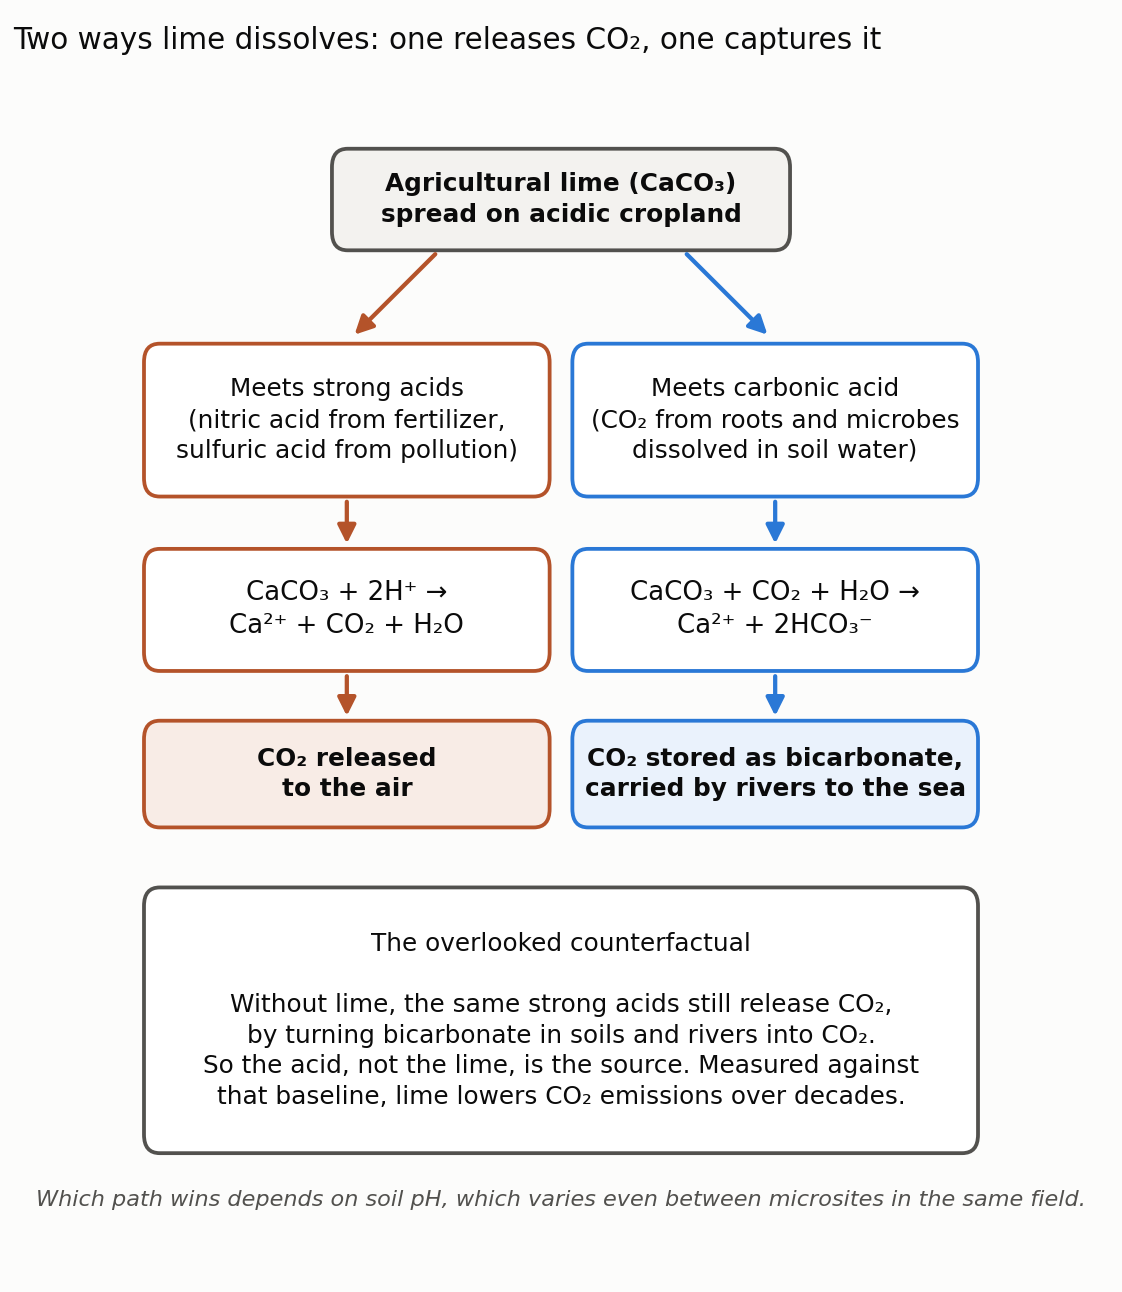
Figure 1. Lime that dissolves in strong acids releases CO₂; lime that dissolves in carbonic acid captures CO₂ as bicarbonate, which rivers carry to the sea. Strong acids release CO₂ even without lime, which is the baseline the new study uses. Figure by Daeha Kim, a schematic based on Suhrhoff et al. (2026) and Robertson and Hamilton (2026).
The missing baseline
The key step in the paper is a question about the counterfactual: what would happen if the acids were added but the lime were not? The strong acids do not disappear. They react with the bicarbonate already present in soils, groundwater and streams, and convert it to CO₂, which escapes to the air either on the spot or farther downstream. In other words, the CO₂ is released by the acid, not by the lime. Lime only determines where and how it happens.
Current inventories ignore this. The default method of the Intergovernmental Panel on Climate Change (IPCC) assumes that all the carbon in applied lime ends up as CO₂, and the US national inventory assumes about half does. The authors argue that this kind of accounting gives the right answer only when lime inputs exactly balance acid inputs for a long time, which has rarely been true. The fair comparison is between “acid with lime” and “acid without lime”.
A century of acid and lime in the Mississippi Basin
The Mississippi River Basin is a natural test case. It covers 41% of the contiguous United States and about 65% of its cropland, and it receives most of the country’s agricultural lime. The authors reconstructed, county by county and year by year, how much acid and how much lime entered the basin since 1900.
Acid inputs roughly doubled to tripled over the century, from 450–800 moles per hectare per year in the early 1900s to 1,350–1,600 after 1970. Nitrification of fertilizer nitrogen now supplies about half of the total, a share that has grown as clean-air rules cut acid rain. Lime use rose sharply between 1935 and 1950, from about 1 million to about 20 million tonnes a year nationwide. Even so, lime has not kept pace with acid: by 2015 the basin had received about 20 trillion moles more acid than lime, roughly half of all the acid added. Lime is concentrated in the Corn Belt, where it offsets or exceeds the acid; much of the western basin receives acid but almost no lime.
What the model says
Feeding these inputs into a reactive transport model of soil chemistry, the authors compared CO₂ release with and without lime. In 1980, for example, the acids alone would have released about 20 million tonnes of CO₂ a year; with lime, the release fell to about 15 million tonnes (Figure 2a). The inventory methods, which count only lime, put the figure at about 7 million tonnes (IPCC) or 3.5 million tonnes (US inventory), and attribute all of it to the lime. Lime did cause a brief pulse of extra CO₂ when its use first surged in the late 1930s, because it first had to neutralize acidity already stored in the soil. After that, it lowered emissions.
What the river says
A model is only as good as its check against reality, and here the check comes from hydrology. The lower Mississippi has some of the longest water-chemistry records in the world, including alkalinity measurements kept by the New Orleans water utility and the US Geological Survey, which had already shown that the river’s bicarbonate export grew during the twentieth century (Raymond et al. 2008). When lime captures CO₂, the extra bicarbonate has to leave the basin through the river.
Comparing river bicarbonate fluxes with a pre-1935 baseline, the authors estimate that about 0.40 billion tonnes of CO₂ (±0.09) left the basin as lime-related bicarbonate between 1900 and 2015. If every bit of lime added since 1900 had reacted with carbonic acid, the maximum possible removal would have been 0.44 billion tonnes. About 90% of the potential has therefore been realized (Figure 2b). The soil model gives a lower but overlapping 0.22–0.37 billion tonnes, and changes in the river’s ratio of calcium and magnesium to bicarbonate point the same way. Losses of bicarbonate to deep groundwater, about 11% in this basin, are not counted and would add to the sink.
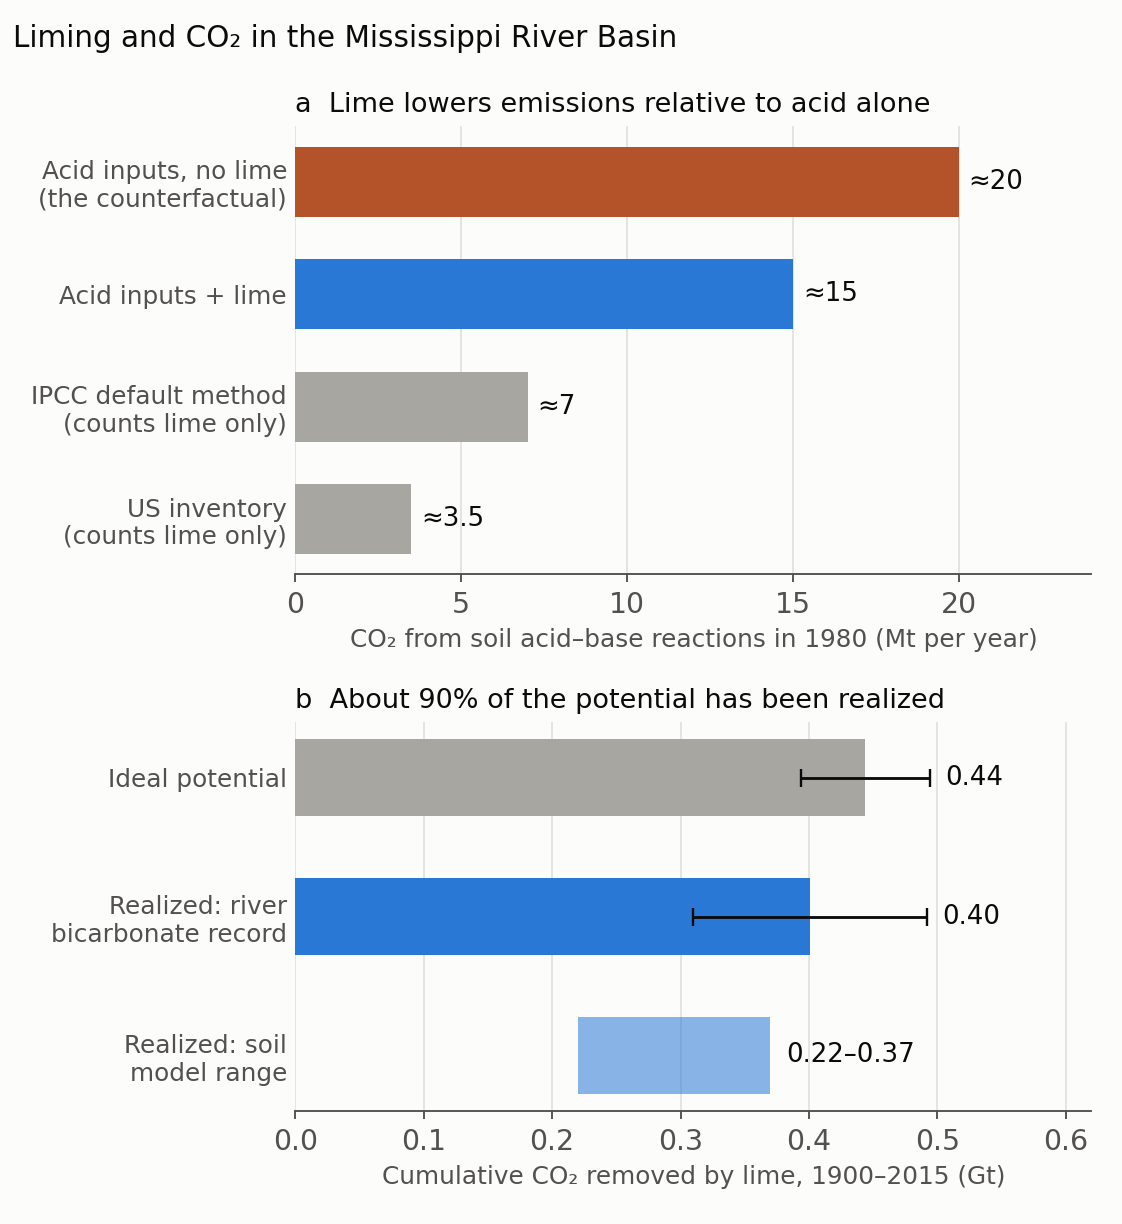
Figure 2. (a) CO₂ released by soil acid–base reactions in the Mississippi River Basin in 1980: modeled with anthropogenic acid inputs alone and with lime added, compared with the lime-only estimates of the IPCC default method and the US national inventory. (b) Cumulative CO₂ removed by lime, 1900–2015: the ideal maximum, the estimate from river bicarbonate records (with ±1 standard deviation) and the range of the soil model. Figure by Daeha Kim, drawn from numbers reported in Suhrhoff et al. (2026).
The river also reveals a delay. Carbon removal shows up in the river decades after lime is applied. Calcium released by lime first sticks to soil particles and pushes off stored acidity, and the water then takes time to travel through soils and aquifers; groundwater in the Mississippi system is about ten years old on average. Tile drains, which carry water quickly from fields to ditches, probably shorten this delay.
What it means
For greenhouse-gas inventories, the source should be booked against the acid inputs, mainly nitrogen fertilizer and acid rain, rather than against the lime that neutralizes them. Counting lime as a source misrepresents the size, and over large areas and long periods even the sign, of its climate effect. It may also discourage farmers from keeping soil pH at the level that is best for crops.
For carbon markets, the picture is more nuanced. Robertson and Hamilton point out that liming at normal agronomic rates is ordinary practice, so it would not count as additional carbon removal deserving credit. The authors add a different warning: because ordinary liming is already a sink, projects that spread crushed rock to remove CO₂ (enhanced weathering) must not claim the removal that business-as-usual liming would have achieved anyway. In very acidic soils, lime may also release CO₂ first and remove it only years later, so short-term claims need care.
For agriculture, the result removes an apparent trade-off. Liming raises yields, improves soil health and can reduce emissions of other greenhouse gases; now it appears to remove CO₂ as well, at least at the scale of a large basin over decades.
The authors are careful about the limits. The estimate applies to the Mississippi Basin under its historical liming rates. Other regions, much heavier applications or very acidic soils may behave differently, and the modeled delay is uncertain by about 30 years across plausible hydrological settings.
What a hydrologist takes from it
Rivers are integrating sensors. A single sampling point near the mouth of the Mississippi summarizes the chemistry of 41% of a continent. Without that century-long record of alkalinity, this argument would rest on a model alone.
Long records are irreplaceable. The baseline before 1935 exists only because a city water utility kept measuring the river. Monitoring programs often look expensive and unexciting until a question like this one arrives.
Water travel times set carbon timescales. The delay between lime application and carbon export is partly a hydrological residence time. Questions about soil carbon removal are, in part, questions about how fast water moves through soils and aquifers.
Bottom line
Agricultural lime has been counted as a CO₂ source because dissolving limestone in acid releases CO₂. But the acid comes from fertilizer and pollution, and it would release CO₂ anyway by destroying bicarbonate in soils and rivers. Measured against that baseline, a century of liming in the Mississippi Basin has removed about 0.4 billion tonnes of CO₂, around 90% of its maximum potential, with a delay of decades. The finding calls for revising how inventories treat liming and shows how much a long river record can reveal about the carbon cycle.
Questions to think about
- If the CO₂ source is the acid rather than the lime, how would you change the carbon footprint of nitrogen fertilizer?
- Why might the decades-long delay between liming and river carbon export be shorter in tile-drained fields than in naturally drained ones?
- Many Korean upland soils are acidic and receive lime. Which river and soil data would be needed to test whether liming acts as a carbon sink in a Korean catchment?
한 줄 요약 (Korean summary). 농경지 산성화를 막기 위해 뿌리는 석회(탄산칼슘)는 녹을 때 CO₂를 내놓는다는 이유로 그동안 온실가스 배출원으로 계산되어 왔다. Suhrhoff 등(2026)은 미시시피강 유역의 100년간 산·석회 투입 기록과 하천 수질 기록을 분석해 이 통념을 뒤집었다. 석회는 질산·황산 같은 강산과 만나면 CO₂를 내놓지만, 토양 속 탄산과 만나면 오히려 CO₂를 흡수해 중탄산염 형태로 바다까지 운반한다. 더 중요한 점은 비료와 산성비에서 온 강산은 석회가 없어도 토양과 하천의 중탄산염을 CO₂로 바꿔 배출하므로, 배출의 원인은 석회가 아니라 산이라는 것이다. 산만 투입된 경우와 비교하면 1980년 기준 석회는 배출을 연간 약 2,000만 톤에서 1,500만 톤으로 줄였다. 하천 중탄산염 기록에 따르면 1900–2015년 석회로 약 4억 톤(±0.9억 톤)의 CO₂가 제거되어 이론적 최대치(4.4억 톤)의 약 90%가 실현되었고, 토양 내 양이온 교환과 지하수 체류시간(약 10년) 때문에 수십 년의 지연이 있었다. 이 결과는 온실가스 인벤토리가 석회가 아니라 산 투입을 배출원으로 다뤄야 함을 보여준다. 다만 일반적인 시비량의 석회는 추가적인 탄소 제거로 인정하기 어렵고, 다른 지역이나 강산성 토양에 그대로 적용하려면 별도의 검증이 필요하다.
References
Suhrhoff, T. J., Reinhard, C. T., Kanzaki, Y., Tsao, S. S.-E., Woollen, B., Reershemius, T., Shaheen, S., Saiers, J., Zhang, S., Raymond, P. A., & Planavsky, N. J. (2026). Agricultural liming is a carbon sink in the Mississippi River Basin. Nature, 658, 113–118. https://doi.org/10.1038/s41586-026-11040-2
Robertson, G. P., & Hamilton, S. K. (2026). A widespread agricultural practice is an unexpected CO₂ sink. Nature, 658, 39–41. https://doi.org/10.1038/d41586-026-02646-7
Hamilton, S. K., Kurzman, A. L., Arango, C., Jin, L., & Robertson, G. P. (2007). Evidence for carbon sequestration by agricultural liming. Global Biogeochemical Cycles, 21, GB2021. https://doi.org/10.1029/2006GB002738
Raymond, P. A., Oh, N.-H., Turner, R. E., & Broussard, W. (2008). Anthropogenically enhanced fluxes of water and carbon from the Mississippi River. Nature, 451, 449–452. https://doi.org/10.1038/nature06505
Both figures are original. The Python scripts that produce them are available on GitHub: Figure 1, Figure 2.