How much water and carbon does AI use?
A question to a chatbot feels weightless. There is no smokestack, no pipe, nothing to see. But every answer is computed on chips that turn electricity into heat, and that heat has to go somewhere. In most data centers it leaves as water vapor, either from the building’s own cooling towers or from the power plants that supply the electricity. In other words, AI is a thermodynamic system, and thermodynamic systems drink.
Four papers published this year look at this problem from different angles. Alex de Vries-Gao estimates the carbon and water footprints of AI from what tech companies report (de Vries-Gao 2026). Ana Pinheiro Privette, Ana Barros and Ximing Cai, writing in AGU Advances, focus on local water impacts and the lack of data (Privette et al. 2026). Zohar Barnett-Itzhaki reviews cooling technologies and governance in Water Research (Barnett-Itzhaki 2026). And Navid Saleh argues in Environmental Science & Technology that the next problem is not how much water, but what kind (Saleh 2026). This post reads them together.
Three ways AI uses water
The papers agree on three pathways.
- On site (direct). Servers are cooled by air or liquid, and the heat is usually rejected in evaporative cooling towers. The water that evaporates is lost to the local supply. Depending on cooling technology and climate, evaporative systems lose about 1 to 9 liters per kWh of server energy; air-cooled facilities use almost none.
- At the power plant (indirect). Thermoelectric plants evaporate water for cooling, and hydropower reservoirs lose water to evaporation. On average, US electricity generation consumes about 7.6 liters per kWh.
- In the supply chain. Chip fabrication needs large volumes of ultra-pure water; an average chip plant uses about 38 million liters per day.
Two definitions matter for anyone who reads these numbers. Withdrawal is the water taken from a river, aquifer or utility; consumption is the part that is not returned, mostly because it evaporates. A once-through cooling system withdraws a lot and consumes little (but returns warmer water), while a cooling tower withdraws less and consumes most of it. Barnett-Itzhaki warns that company reports often mix the two. The industry’s efficiency metric, water usage effectiveness (WUE), is the on-site water used per kWh of IT energy; its sister metric, power usage effectiveness (PUE), is the facility’s total electricity divided by the IT electricity.
How big is it?
The International Energy Agency (IEA) estimated that data centers consumed 460 TWh of electricity in 2024, producing about 182 million tonnes of CO₂, and 560 billion liters of water in 2023. AI is the fastest-growing part. De Vries-Gao uses estimates of AI hardware power demand, which rose from 9.4 GW at the end of 2024 to perhaps 23 GW by the end of 2025, almost half of all data center demand and approaching the average electricity demand of the United Kingdom. Combining this with average carbon and water intensities checked against company reports, he estimates that AI systems alone could emit 32.6–79.7 million tonnes of CO₂ and consume 312–765 billion liters of water in 2025.
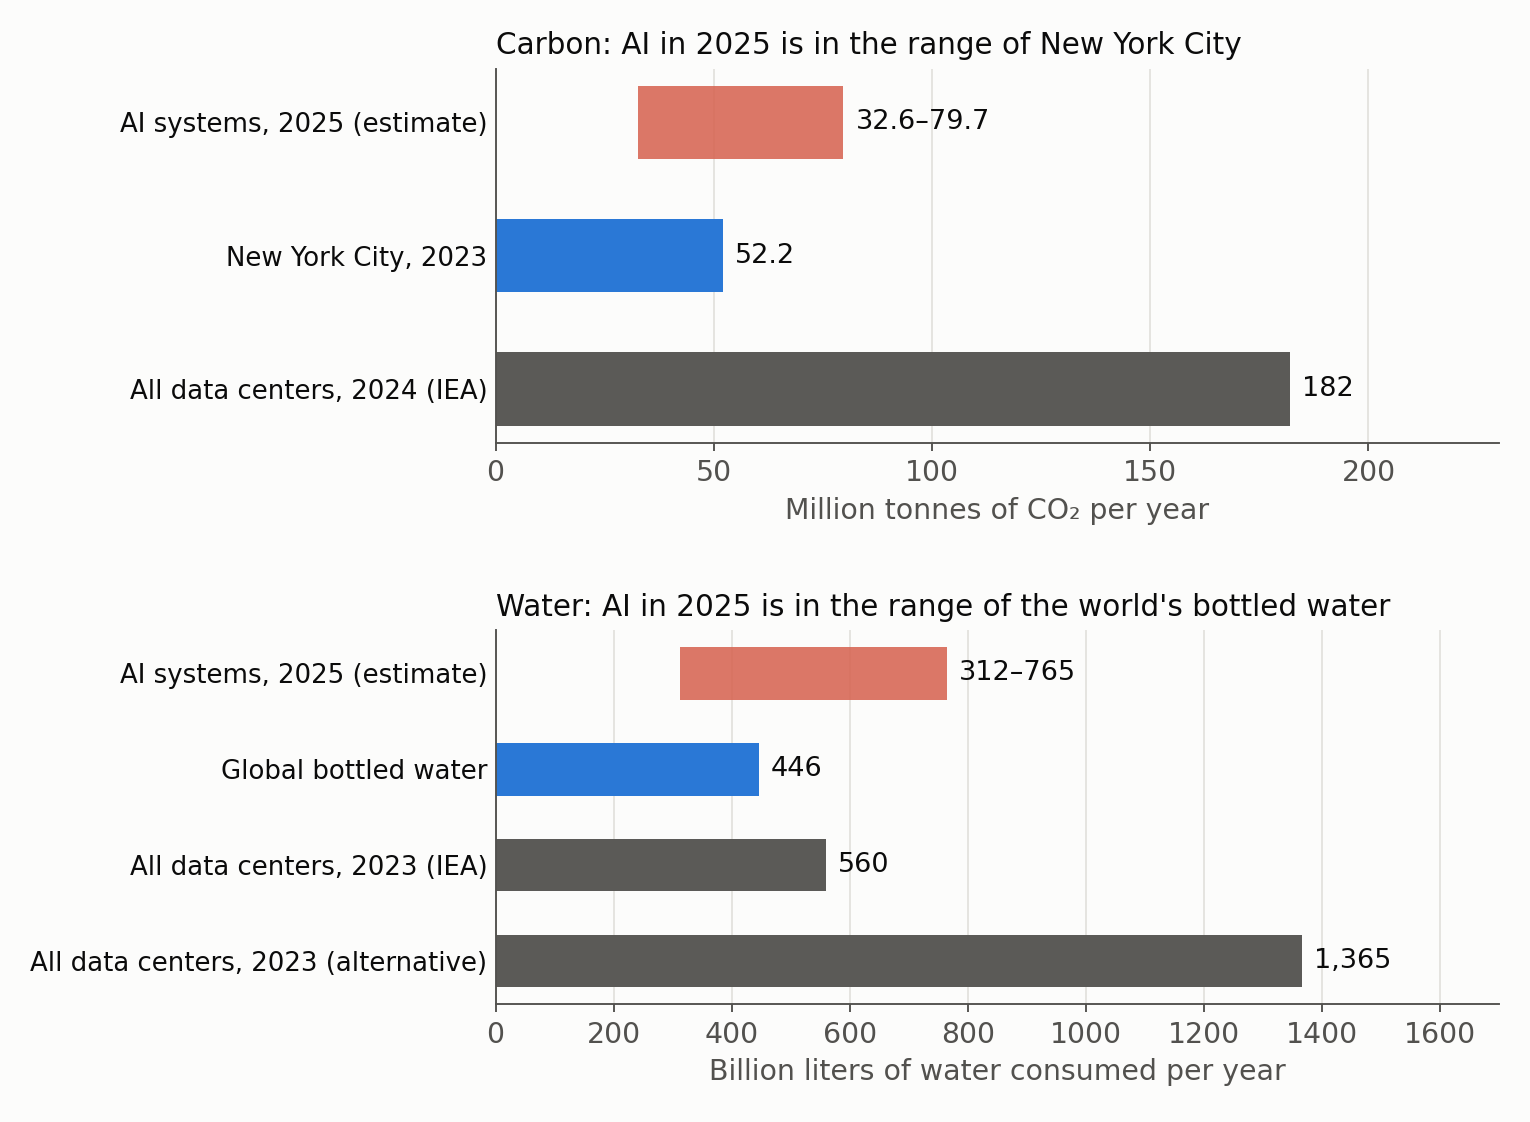
Figure 1. Estimated carbon (top) and water (bottom) footprints of AI systems in 2025, compared with the emissions of New York City and the world’s annual bottled water consumption. The gray bars show all data centers: the IEA estimates and, for water, an alternative estimate based on the water intensity of electricity reported by tech companies. Figure by Daeha Kim, drawn from numbers reported in de Vries-Gao (2026).
For scale, the carbon range brackets the emissions of New York City (52.2 million tonnes in 2023), and the water range brackets the world’s entire bottled water consumption (446 billion liters per year).
Readers may have seen a much larger number: that AI’s water footprint could reach 4.2–6.6 billion cubic meters a year by 2027, cited by Barnett-Itzhaki from earlier work by Li and colleagues. That is roughly ten times larger, and for 2027 rather than 2025. Much of the difference comes from definitions: the larger figure refers to water withdrawn, much of which is returned, while de Vries-Gao counts water consumed. It is a good example of why the withdrawal–consumption distinction is not pedantry.
Most of the water is hidden at the power plant
The most important finding in de Vries-Gao’s paper concerns the indirect water. On site, the numbers are consistent: the IEA implies a WUE of about 0.56 liters per kWh, and the tech companies’ own reports average 0.59. But for the water consumed in generating the electricity, the IEA implies only 1.04 liters per kWh. Every other estimate is three to five times higher: Meta reports 3.92 liters per kWh for its own electricity, the US data centers of Apple, Google and Meta come out at about 3.40, and Lawrence Berkeley National Laboratory finds 4.52 for all US data centers.
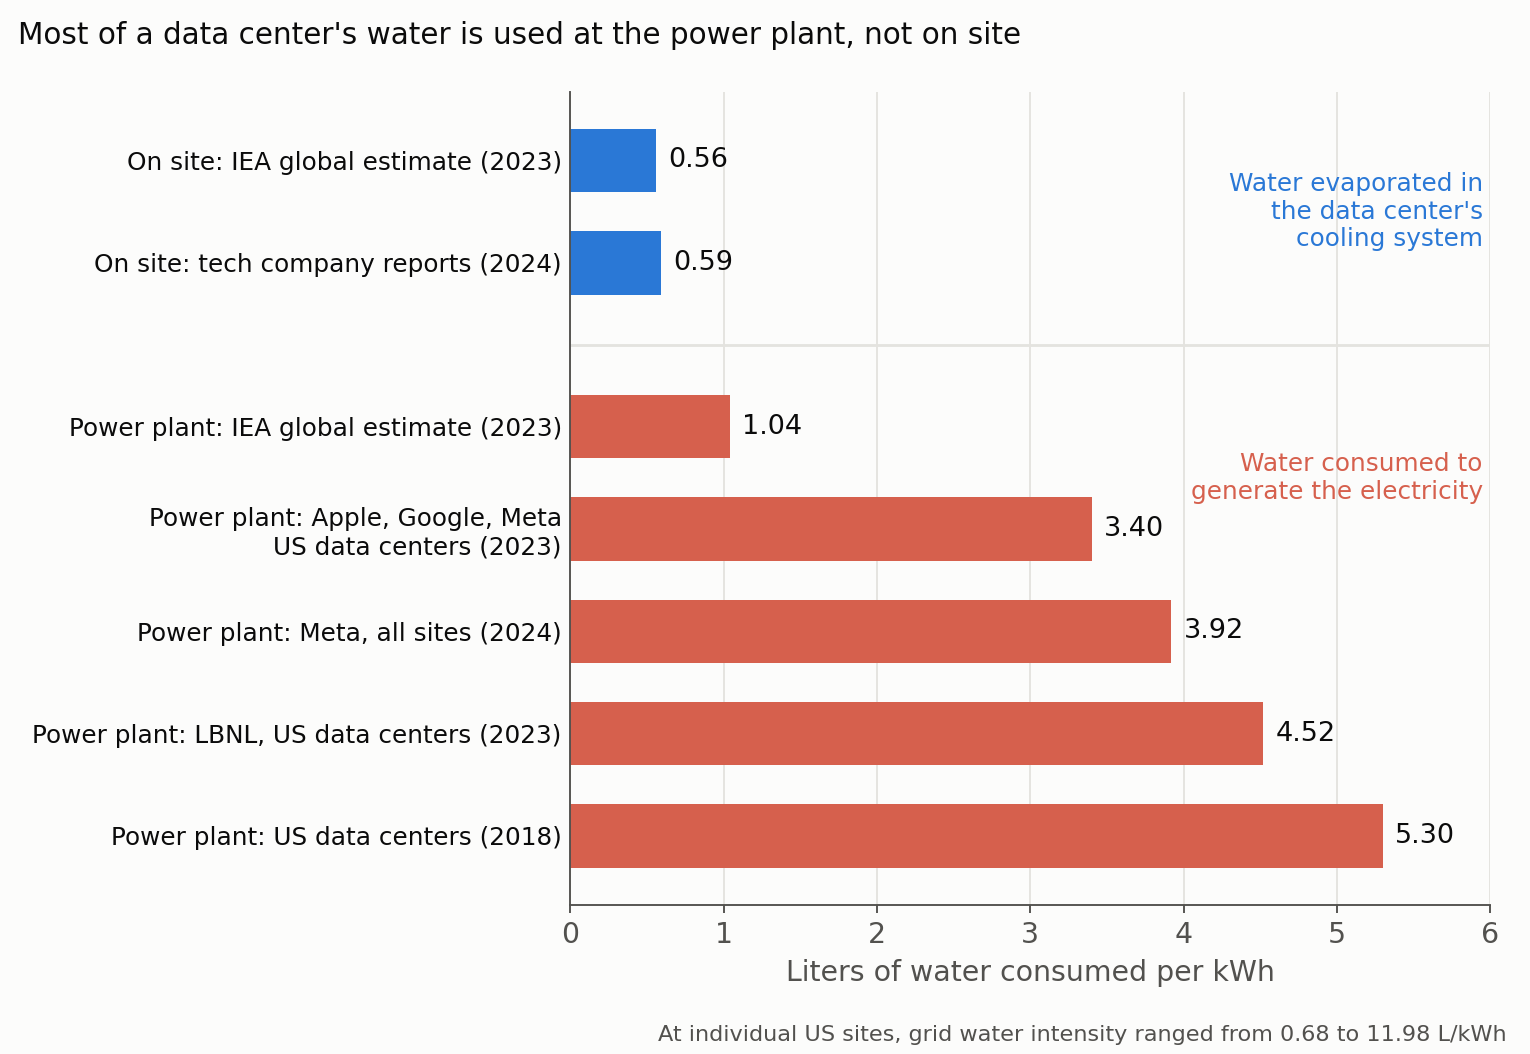
Figure 2. Water consumed per kWh of data center electricity, on site (blue) and at the power plants that generate the electricity (red), from different sources. The IEA’s estimate of indirect water is much lower than estimates based on company reports and US national data. Figure by Daeha Kim, drawn from numbers reported in de Vries-Gao (2026).
If the companies’ 3.40 liters per kWh is applied to the IEA’s 360 TWh for 2023, data centers consumed about 1,225 billion liters of water at power plants, plus 140 billion liters on site. That is more than twice the IEA’s total. In other words, the global water footprint of data centers may be substantially underestimated, and most of it is not in the data center at all.
For a hydrologist, the spread across sites is just as striking. At the US locations examined, the water intensity of the local grid ranged from 0.68 to almost 12 liters per kWh, depending on whether the electricity comes from thermoelectric plants, hydropower reservoirs or wind and solar. Where a data center is built, and which grid it draws from, can change its water footprint by more than a factor of ten.
The local picture matters more than the global one
Measured against national totals, data center water use looks small. US data centers account for about 0.3% of the public water supply of the contiguous United States, while agriculture accounts for about 70% of freshwater withdrawals. Privette and colleagues argue that this is exactly the wrong scale to look at.
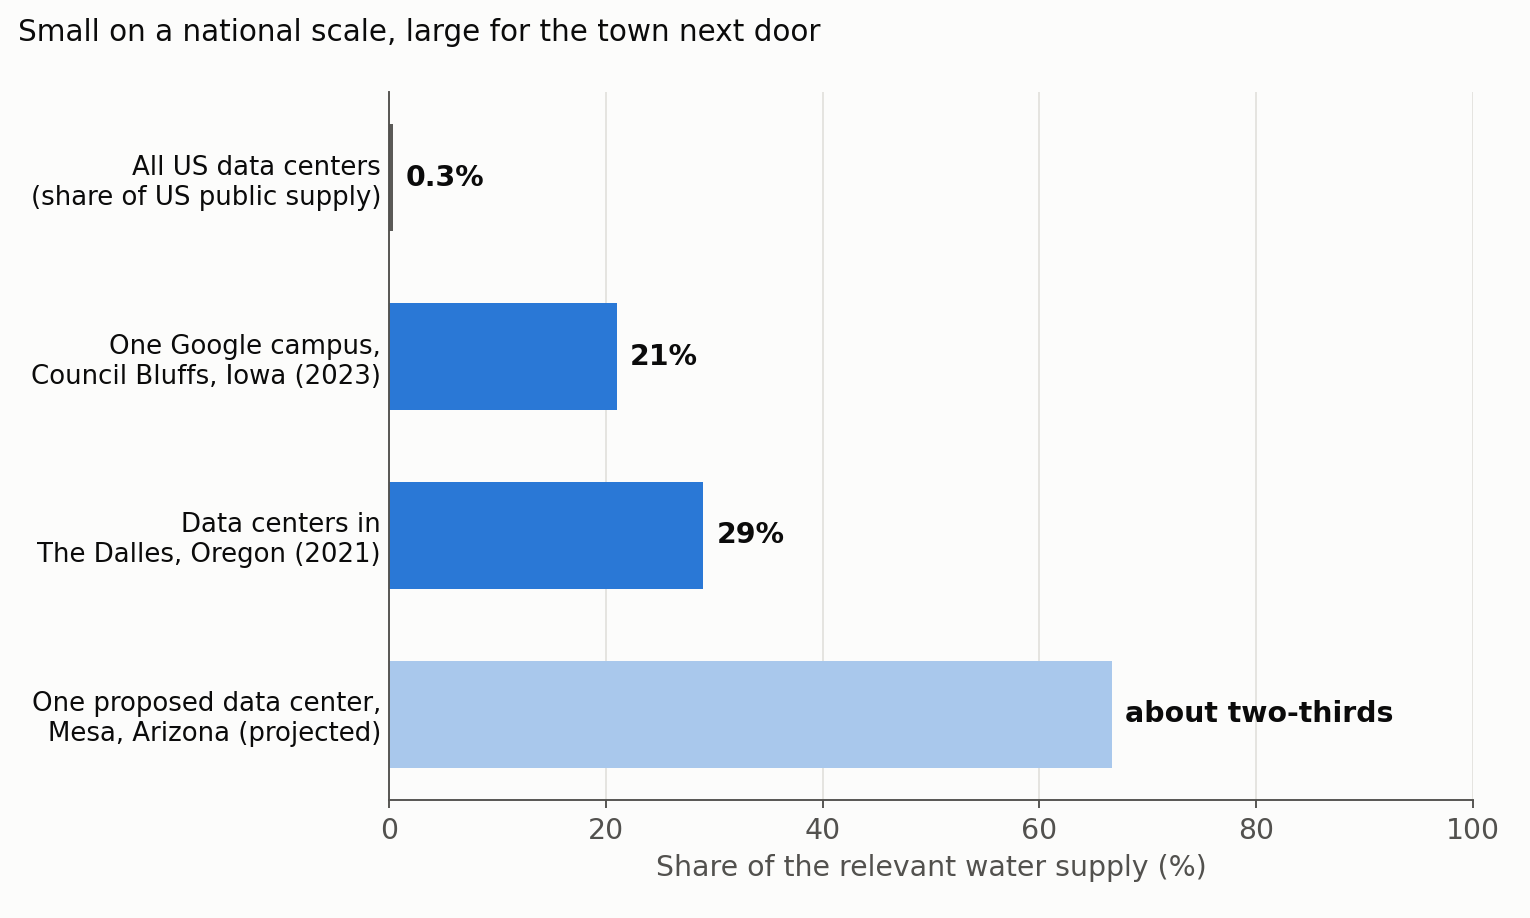
Figure 3. Data center water use as a share of the relevant supply: nationally in the United States, and in three US cities. The Mesa value is a projection for one proposed facility at full operation. Figure by Daeha Kim, drawn from numbers reported in Privette et al. (2026).
In 2023, one Google campus in Council Bluffs, Iowa, consumed about 3.7 billion liters, about 21% of the city’s total water use and equivalent to adding more than 4,700 residents. In The Dalles, Oregon, data center water use nearly tripled in five years to about 29% of the city’s demand in 2021. In Mesa, Arizona, one proposed data center was projected to use about two-thirds of the city’s daily supply at full operation. More than 97% of the water consumed by major operators comes from municipal drinking water systems, and since 2022 nearly two-thirds of new US data centers have been built in areas of high water stress.
Barnett-Itzhaki adds a case from Mexico. In Colón, a town of 67,000 people north of Mexico City, a hyperscale campus was built during a severe drought, while the region’s reservoirs ran low and farming communities relied on trucked water. Industrial water concessions, once granted, are rarely revisited when supply shrinks. The problem there is less the technology than the water allocation rules.
Cooling choices are trade-offs
The technology to cut on-site water use exists. Barnett-Itzhaki compares the options:
- Evaporative cooling is energy-efficient but uses about 2–3 liters per kWh, roughly 25,500 cubic meters a year for each megawatt of IT load.
- Free-air cooling in cold climates can bring WUE below 0.3, but only works in a few regions and needs backup on hot days.
- Lake or sea water can bring consumption close to zero, but returns water 5–8°C warmer, which can disturb lake stratification and oxygen levels.
- Waterless designs (dry coolers, immersion cooling) eliminate on-site water use, but use about 10–25% more electricity, which shifts water use and carbon emissions to the power plant.
- Reclaimed wastewater spares drinking water but needs separate pipes and treatment.
There is no free option. Saving water on site usually costs energy, energy costs carbon and water elsewhere, and the sunniest places for solar power tend to be the driest. Barnett-Itzhaki also points out an economic reason why evaporative cooling remains popular: electricity is typically 40–60% of a data center’s operating costs, while water is priced far below its scarcity value.
Not only how much, but what kind of water
Saleh adds a point that water engineers will recognize. As operators switch to recirculating cooling and reclaimed wastewater, the problem shifts from quantity to quality. Cooling towers lose water by evaporation and leave the dissolved salts behind. Systems typically run at three to ten “cycles of concentration,” so water that enters with about 200 mg of dissolved solids per liter can exceed 1,000 mg per liter. Scaling, corrosion, silica deposits and the disposal of the concentrated blowdown then become the limiting factors, even when there is enough water. Waterless cooling fluids raise their own questions about composition, life cycle and disposal. In Saleh’s words, water demand asks whether water is available; water compatibility asks whether it can be used sustainably.
The first problem is the missing data
All four papers return to the same point: we cannot manage what is not measured. None of the eleven companies that de Vries-Gao examined reports any AI-specific environmental data. Only Meta reports the water embedded in its purchased electricity. Fewer than a third of operators even track WUE. Privette and colleagues note that local governments and utilities sometimes sign non-disclosure agreements or treat a data center’s water use as a trade secret. The papers’ recommendations are consistent:
- report water use, WUE and PUE for each facility, separating withdrawal from consumption;
- include the water embedded in purchased electricity, just as greenhouse gas reporting already includes emissions from purchased electricity;
- assess water availability and cumulative demand before a site is approved, not after;
- treat AI demand as one water user among others in regional water planning.
Barnett-Itzhaki goes further and proposes “digital water sobriety”: asking which AI applications justify their water use in a stressed watershed, much as we already ask which crops justify irrigation.
What a hydrologist takes from it
Footprints must be read at the scale of the catchment. A national total of 0.3% says little about a town where one facility uses a fifth of the supply. The right denominator is the local water budget, in the season when it is tightest.
The water–energy–carbon nexus is real, and data centers sit in the middle of it. Moving water use from the cooling tower to the power plant does not make it disappear; it moves it to another basin. Any honest assessment has to track all three.
This is planning work we already know how to do. Demand forecasting, drought reliability, allocation rules and environmental flow limits are the everyday tools of water resources engineering. What is new is a user that arrives fast, in large blocks, and often without disclosing its numbers.
Bottom line
- AI systems alone may have emitted 33–80 million tonnes of CO₂ and consumed 310–770 billion liters of water in 2025, but these are estimates built on very incomplete data.
- Most of a data center’s water footprint is at the power plant, and global estimates of that part may be several times too low.
- Nationally, data centers use little water; locally, a single facility can use a fifth or more of a city’s supply.
- Every cooling option trades water against energy and carbon; reuse adds water quality challenges.
- Facility-level, standardized disclosure of water and energy use is the first step.
Questions to think about
- A data center switches from evaporative to dry cooling and uses 20% more electricity. Under what grid mix would its total water footprint go down, and when would it go up?
- Why is water consumption, rather than withdrawal, the more relevant measure for a cooling tower, and the less relevant one for a once-through cooling system?
- If you were the water utility in a small city asked to supply a new data center, what information would you require before agreeing, and how would you test the drought reliability of your system with the new demand?
한 줄 요약 (Korean summary). 눈에 보이지는 않지만 AI는 계산 과정에서 나오는 열을 식히기 위해 데이터센터의 냉각탑에서, 그리고 전기를 만드는 발전소에서 물을 증발시킨다. 올해 게재된 네 편의 논문을 종합하면, AI 시스템만으로 2025년에 약 3,300만–8,000만 톤의 이산화탄소를 배출했을 수 있고, 3,100억–7,700억 리터의 물을 소비했을 수 있다(뉴욕시의 연간 배출량, 전 세계 생수 소비량과 비슷한 규모). 데이터센터의 물 사용 대부분은 현장 냉각이 아니라 발전 과정에서 생기며, 기업 보고 자료로 보면 국제에너지기구(IEA)의 추정치는 이 부분을 크게 과소평가했을 가능성이 있다. 미국 전체로는 데이터센터가 공공 급수의 약 0.3%에 불과하지만, Council Bluffs, Iowa에서는 구글 캠퍼스 하나가 도시 물 사용량의 약 21%를 차지했다. 냉각 방식은 물·에너지·탄소 사이의 맞교환이며, 물을 재이용하면 농축된 염분과 같은 수질 문제가 새로 생긴다. 무엇보다 시설별로 물 취수량과 소비량, 그리고 구매 전력에 포함된 물까지 표준화해 공개하는 것이 첫 단계이며, 데이터센터를 지역 물 계획 안의 한 수요자로 다뤄야 한다.
References
de Vries-Gao, A. (2026). The carbon and water footprints of data centers and what this could mean for artificial intelligence. Patterns, 7, 101430. https://doi.org/10.1016/j.patter.2025.101430
Privette, A. P., Barros, A., & Cai, X. (2026). Data centers water footprint: The need for more transparency. AGU Advances, 7, e2025AV002140. https://doi.org/10.1029/2025AV002140
Barnett-Itzhaki, Z. (2026). The water footprint of artificial intelligence: Emerging solutions and governance imperatives. Water Research, 299, 125866. https://doi.org/10.1016/j.watres.2026.125866
Saleh, N. B. (2026). Why water demand is no longer enough: Rethinking sustainability in AI data centers. Environmental Science & Technology, 60, 18383–18386. https://doi.org/10.1021/acs.est.6c08380
All three figures are original. The Python scripts that produce them are available on GitHub: Figure 1, Figure 2 and Figure 3.